Are Mexican Carriers Safer or Riskier Than US Carriers?

Data reveals a safety performance paradox: exceptional drivers, challenging equipment outcomes.
An analysis of 5.6 million commercial vehicle inspections conducted in the United States during 2024 reveals a striking safety performance split for Mexican carriers operating under NAFTA/USMCA trucking provisions. While these carriers outperform US carriers on driver safety, they experience substantially higher equipment violation rates—a pattern that warrants deeper investigation.
The Core Finding
Driver Safety Excellence:
- Mexican carriers: 2.2% driver out-of-service rate
- US carriers: 5.4% driver out-of-service rate
- Mexican carriers achieve 3.2 percentage points lower driver violation rates
Equipment Safety Challenges:
- Mexican carriers: 22.4% vehicle out-of-service rate
- US carriers: 14.5% vehicle out-of-service rate
- Mexican carriers experience 7.9 percentage points higher equipment violation rates
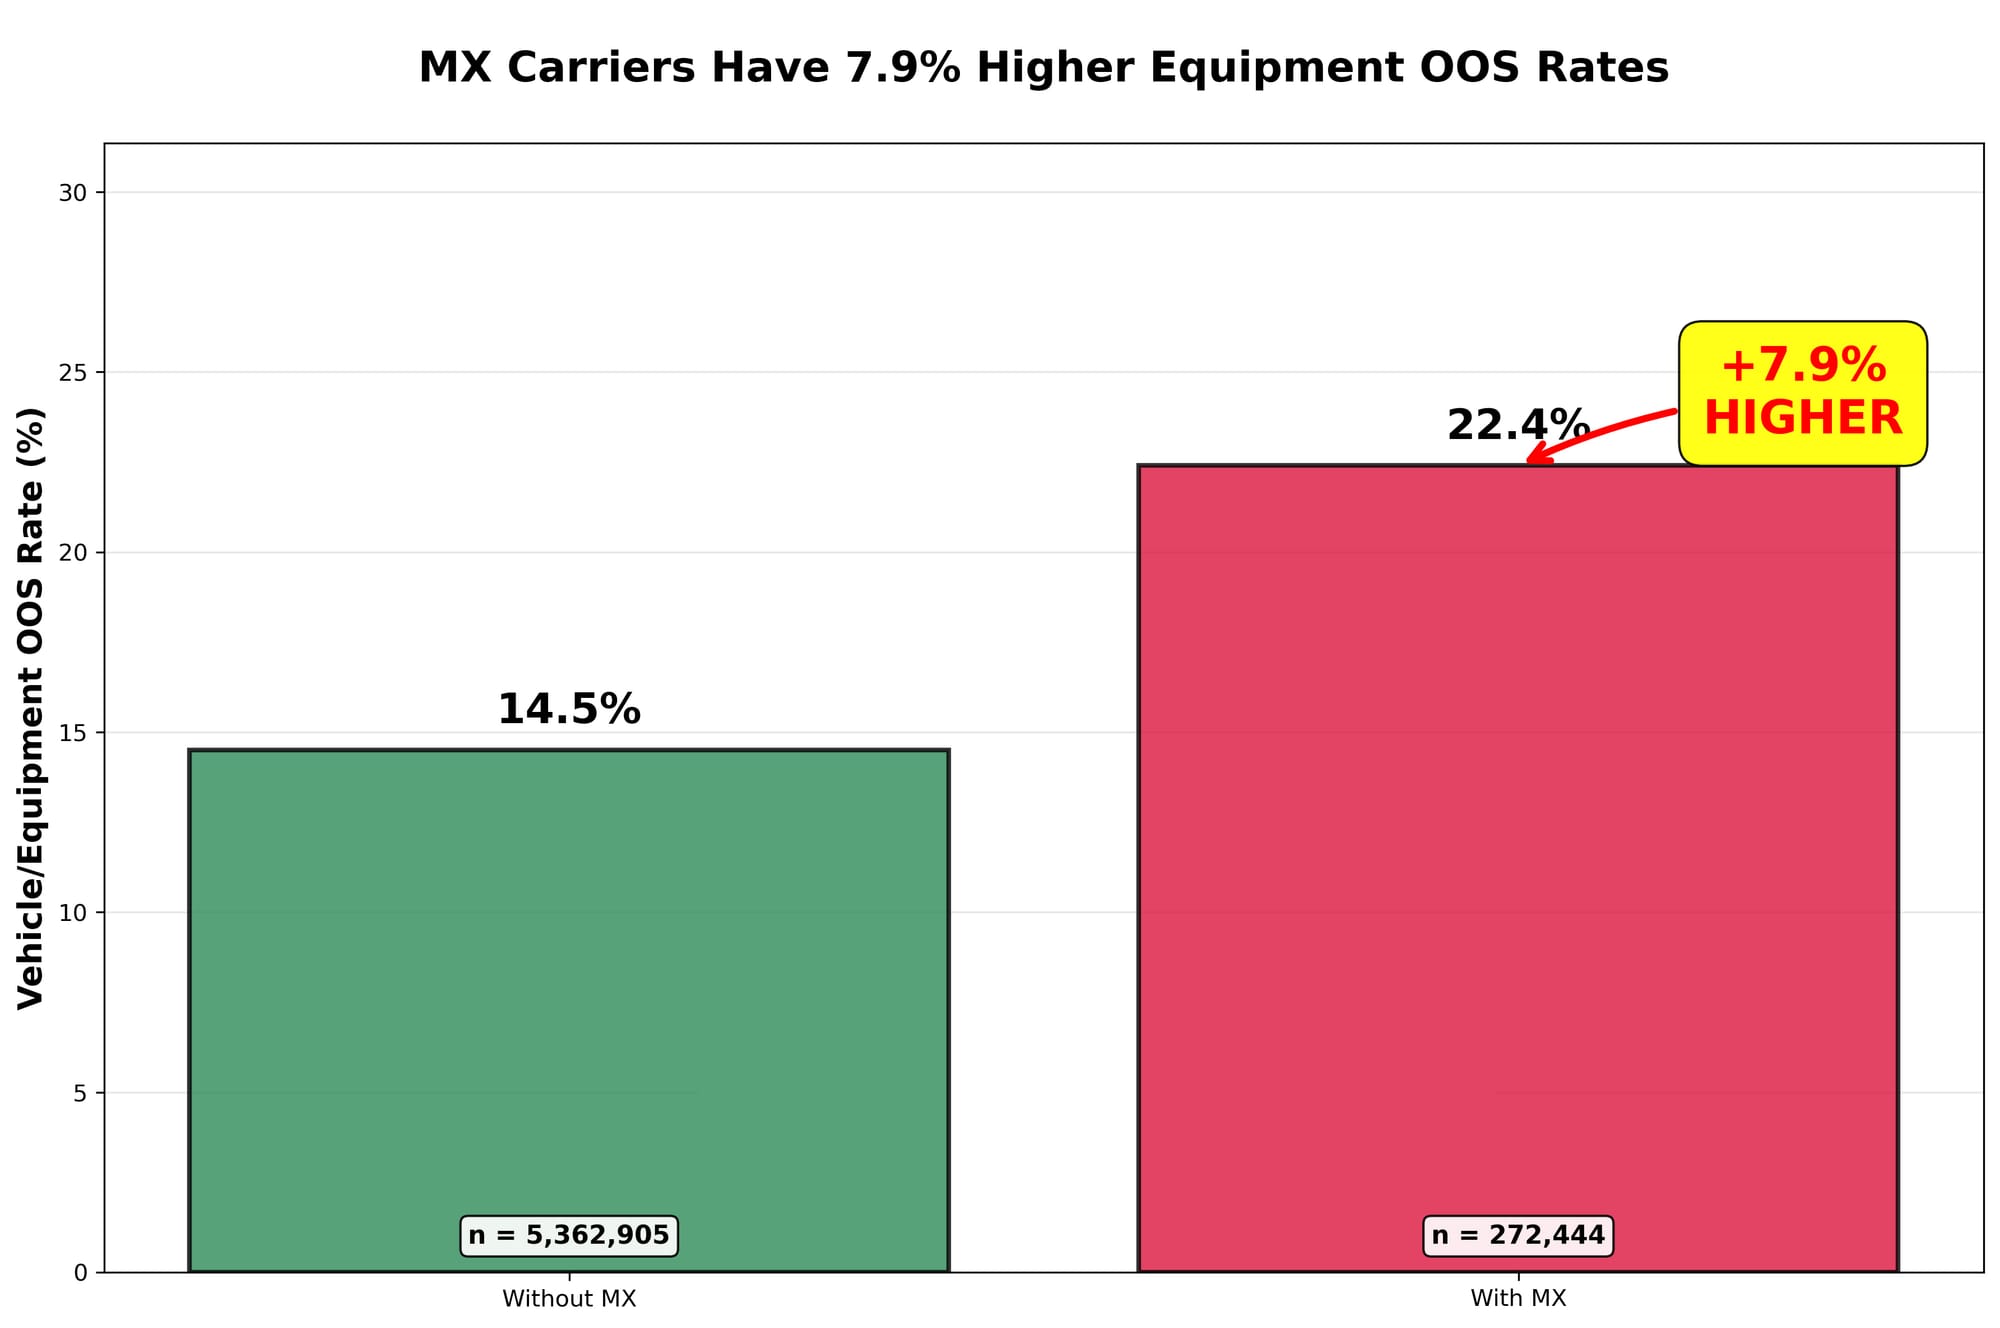
This performance split affects 272,444 Mexican carrier inspections (4.8% of total) compared to 5.36 million US carrier inspections, with Mexican carrier activity concentrated heavily in border states: Texas (24.9% of inspections), New Mexico (8.4%), and Arizona (3.9%).
Investigating the Equipment Safety Gap
Given the clear driver safety excellence, what explains the equipment performance challenges? Analysis reveals two distinct contributing factors.
Factor 1: Fleet Age Differential
Mexican carriers face equipment safety challenges that stem from two components:
Component A: Fleet Age Differential
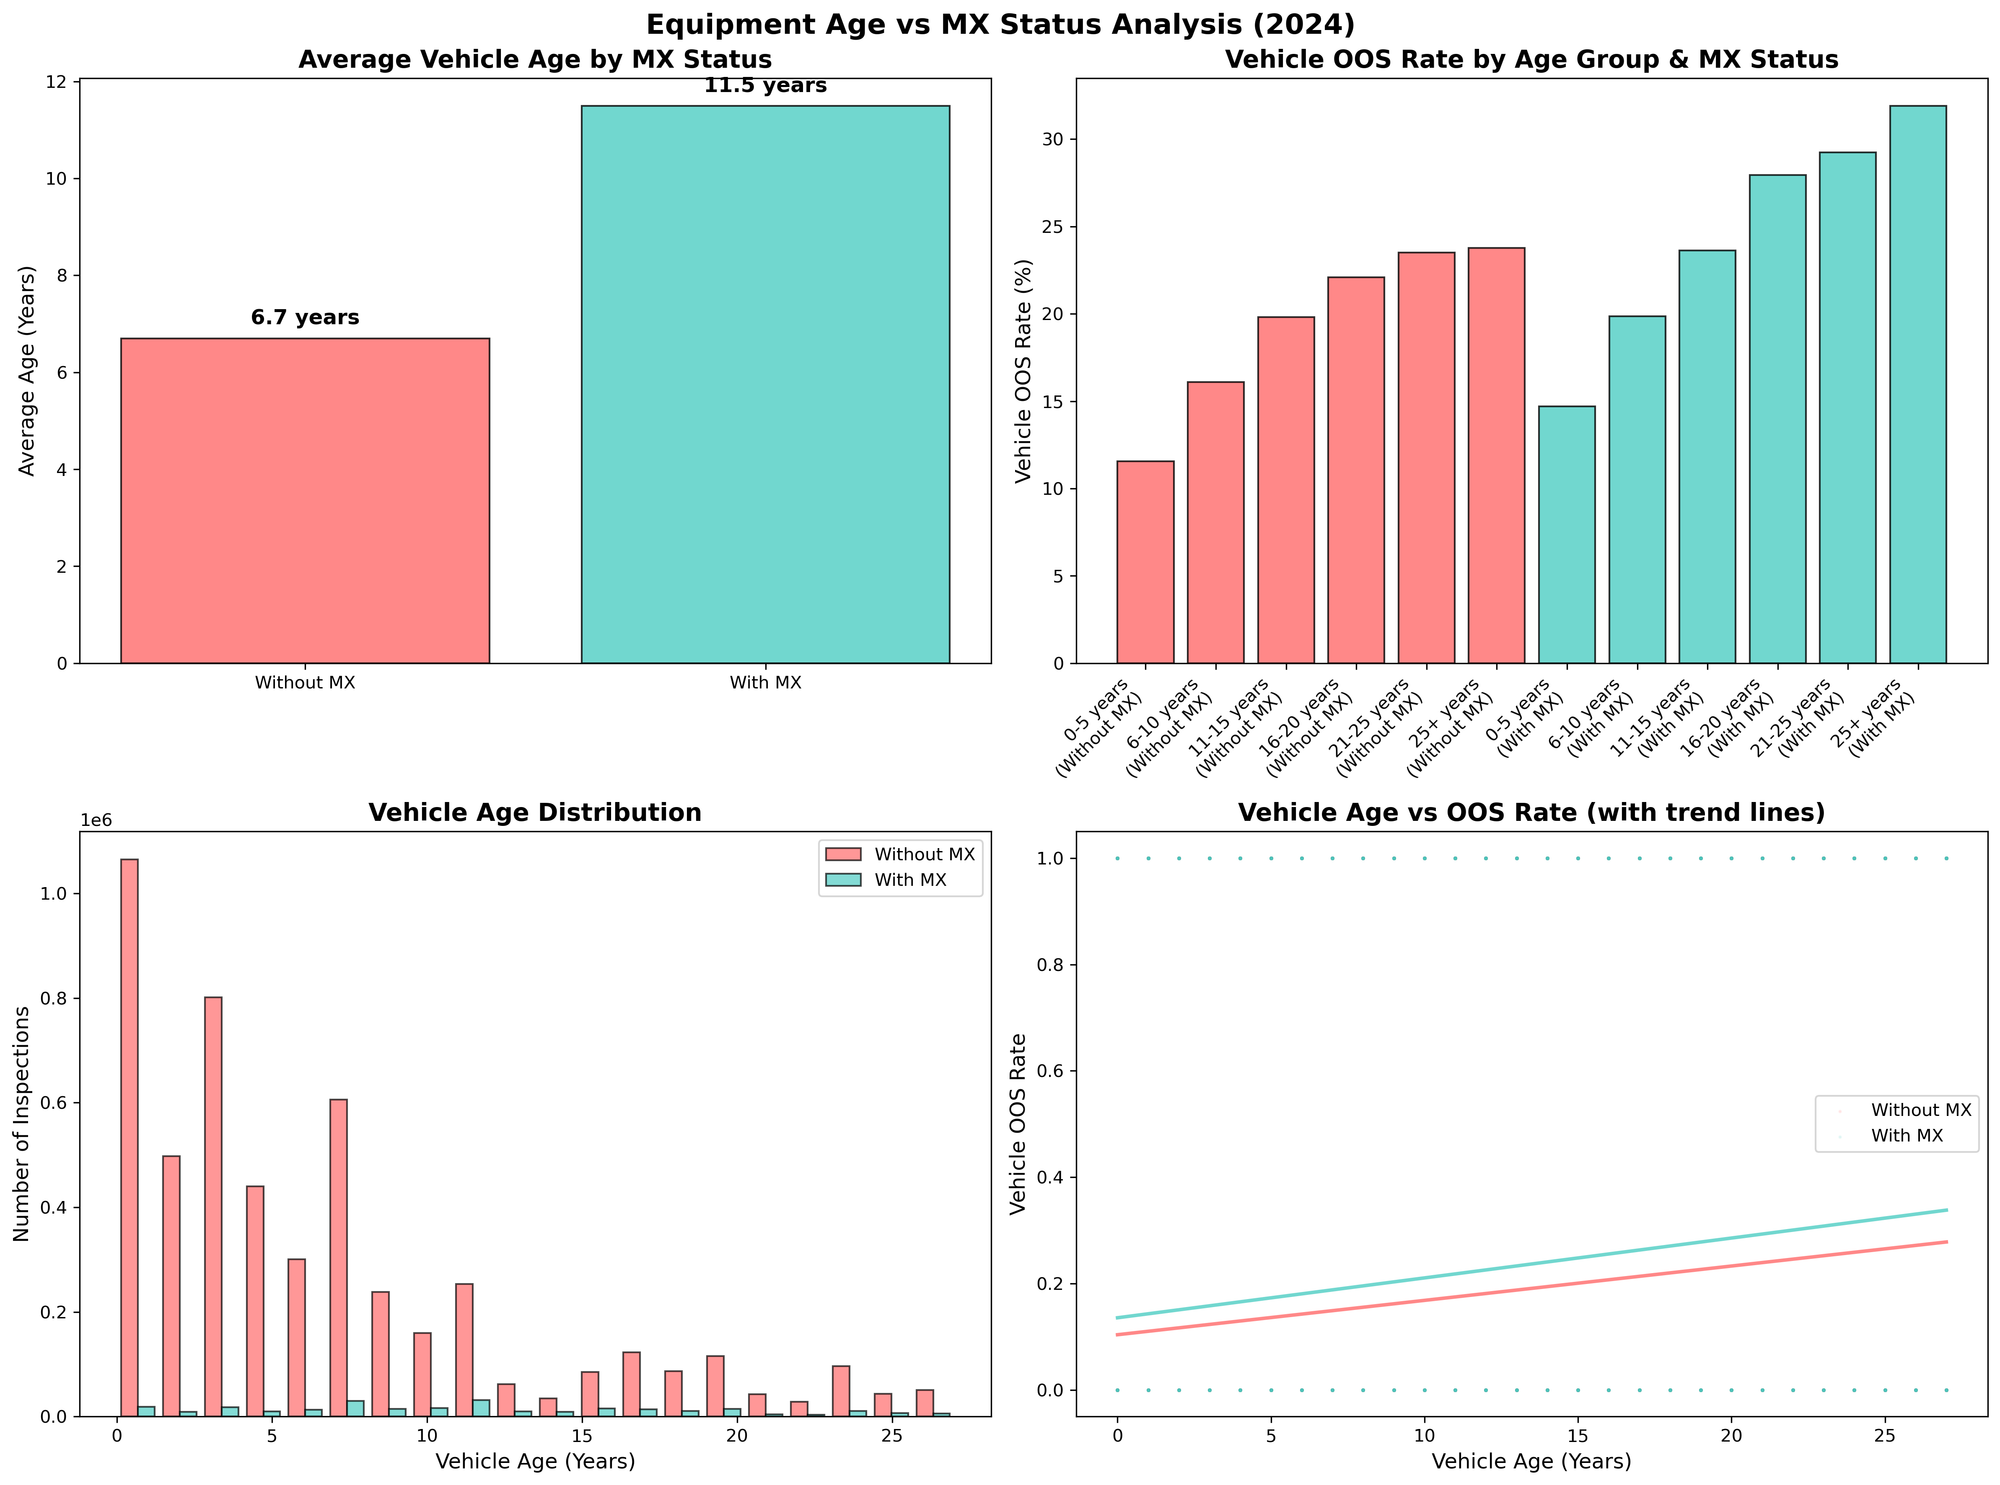
Mexican carriers operate significantly older equipment:
- Mexican carriers: 11.5 years average equipment age
- US carriers: 6.7 years average equipment age
- Difference: 4.8 years older on average
Fleet Composition: Mexican carriers have fundamentally different age profiles:
- 0-5 years: 20.7% (vs 54.7% for US carriers)
- 6-10 years: 27.6% (vs 25.4% for US carriers)
- 11-15 years: 23.0% (vs 7.7% for US carriers)
- 16+ years: 28.7% (vs 12.3% for US carriers)
This age differential matters because older equipment consistently produces higher violation rates for both carrier types, with correlation coefficient of +0.121 between age and vehicle out-of-service rates.
Component B: Age-Independent Performance Gaps
Even accounting for fleet age, Mexican carriers show consistently higher equipment violation rates within every age category:
| Age Group | Mexican Carriers | US Carriers | Difference |
|---|---|---|---|
| 0-5 years | 14.7% | 11.6% | +3.1% |
| 6-10 years | 19.9% | 16.1% | +3.8% |
| 11-15 years | 23.6% | 19.8% | +3.8% |
| 16-20 years | 27.9% | 22.1% | +5.8% |
| 21-25 years | 29.2% | 23.5% | +5.7% |
| 25+ years | 31.9% | 23.8% | +8.1% |
Key Observations:
- Both carrier types show increasing OOS rates with equipment age
- Mexican carriers have higher OOS rates in every age category
- The gap widens for older equipment (3.1% difference for newest trucks vs 8.1% for oldest)
- Fleet age alone does not fully explain the performance differential
Factor 2: Inspection Location Bias
Mexican carriers are disproportionately inspected at stricter enforcement locations:
- 89.0% of Mexican carrier inspections occur at high/very high strictness locations
- 39.3% of US carrier inspections occur at high/very high strictness locations
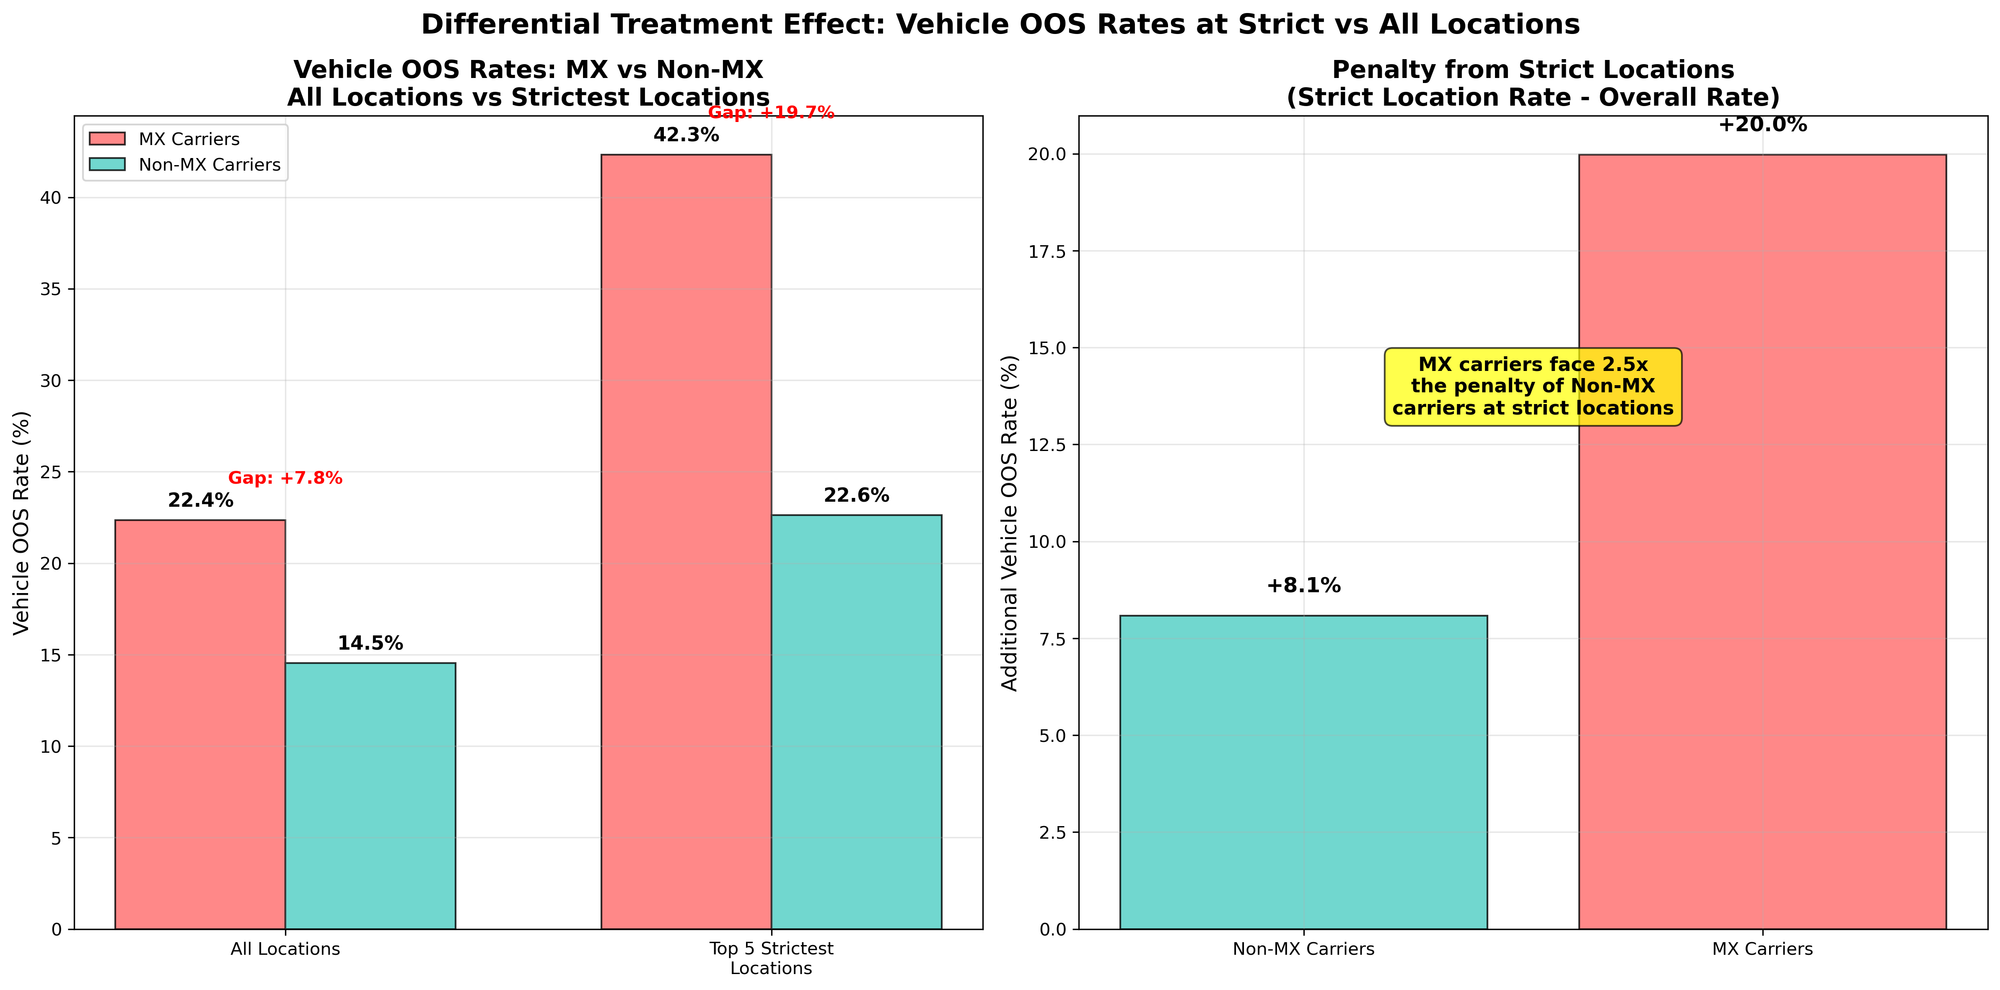
Impact of Location Strictness: Strict locations affect all carriers, but Mexican carriers face disproportionate penalties:
Non-MX Carriers:
- Overall vehicle OOS rate: 14.5%
- At strictest locations: 22.6% (+8.1 percentage point increase)
MX Carriers:
- Overall vehicle OOS rate: 22.4%
- At strictest locations: 42.3% (+19.9 percentage point increase)
This reveals a "double penalty" effect: Mexican carriers are not only more likely to be inspected at strict locations, but also face nearly 2.5x the penalty increase when they are.
Geographic Concentration: 87.2% of Mexican carrier inspections occur at very high strictness locations (20%+ vehicle OOS rates) compared to only 12.7% of US carrier inspections. The correlation between state MX carrier activity and vehicle OOS rates is +0.346, indicating that states with high
What the Data Shows
The analysis reveals that the equipment safety performance gap results from two main factors rather than a single cause:
- Equipment Performance Challenges: Mexican carriers' older equipment inherently has higher failure rates, plus additional age-independent factors that create performance gaps even within the same age categories
- Enforcement Geography: Mexican carriers face inspection at stricter locations nearly 90% of the time and experience disproportionate penalties when inspected there
Meanwhile, Mexican carriers' exceptional driver safety performance—achieving violation rates less than half those of US carriers—demonstrates operational excellence in human capital management that stands independent of equipment challenges.
Geographic and Operational Context
Border State Concentration: Mexican carrier inspections concentrate in specific corridors:
- Texas accounts for the largest volume of Mexican carrier activity
- Border states show vastly higher Mexican carrier adoption rates
- Interior states typically show zero Mexican carrier activity
Inspection Volume:
- Total inspections analyzed: 5,635,349
- Mexican carrier inspections: 272,444 (4.8%)
- US carrier inspections: 5,362,905 (95.2%)
- Total driver out-of-service violations: 293,702
- Total vehicle out-of-service violations: 841,196
Data Coverage and Methodology
This analysis covered 95.7% of all 2024 commercial vehicle inspections with complete age data (5.395 million out of 5.635 million total inspections). The inspection data includes both routine roadside inspections and targeted enforcement actions across all US states and territories.
Inspection location analysis examined 124 significant inspection locations (≥100 inspections each) to identify patterns in enforcement strictness and geographic bias. Locations were categorized by vehicle out-of-service rates ranging from low strictness (0-10%) to very high strictness (20%+).
Mexican carriers are identified through MX number designations in the inspection database, indicating carriers authorized for cross-border operations under NAFTA/USMCA trucking provisions.
Summary
Mexican carriers operating in the US demonstrate a clear safety performance split: exceptional driver safety combined with equipment safety challenges. The equipment performance gap stems from two measurable factors—equipment-related challenges (both age-related and age-independent factors) and inspection location bias—while their driver safety excellence suggests strong professional standards and training practices.
This analysis provides a data-driven foundation for understanding cross-border transportation safety patterns, revealing both the successes and challenges inherent in North American trade transportation operations.
Analysis based on 2024 commercial vehicle inspection data from US Department of Transportation databases.