Brake Safety Week 2025: 60% Year-Over-Year Increase Marks Record Week for Violations
During the week of August 24-30, 2025, commercial vehicle inspectors across North America conducted their annual Brake Safety Week enforcement campaign. The numbers from this intensive inspection period are now in.

During the week of August 24-30, 2025, commercial vehicle inspectors across North America conducted their annual Brake Safety Week enforcement campaign. The numbers from this intensive inspection period are now in.
The Week's Results
Inspectors documented 21,983 brake violations during Brake Safety Week 2025, averaging 3,140 violations per day. This represents a 31.1% increase from the typical daily average of 2,395 violations seen over the previous two years.
The busiest enforcement days were Tuesday and Wednesday, with 4,906 and 4,908 violations respectively. Weekend enforcement dropped significantly, with Sunday recording 758 violations and Saturday 775.
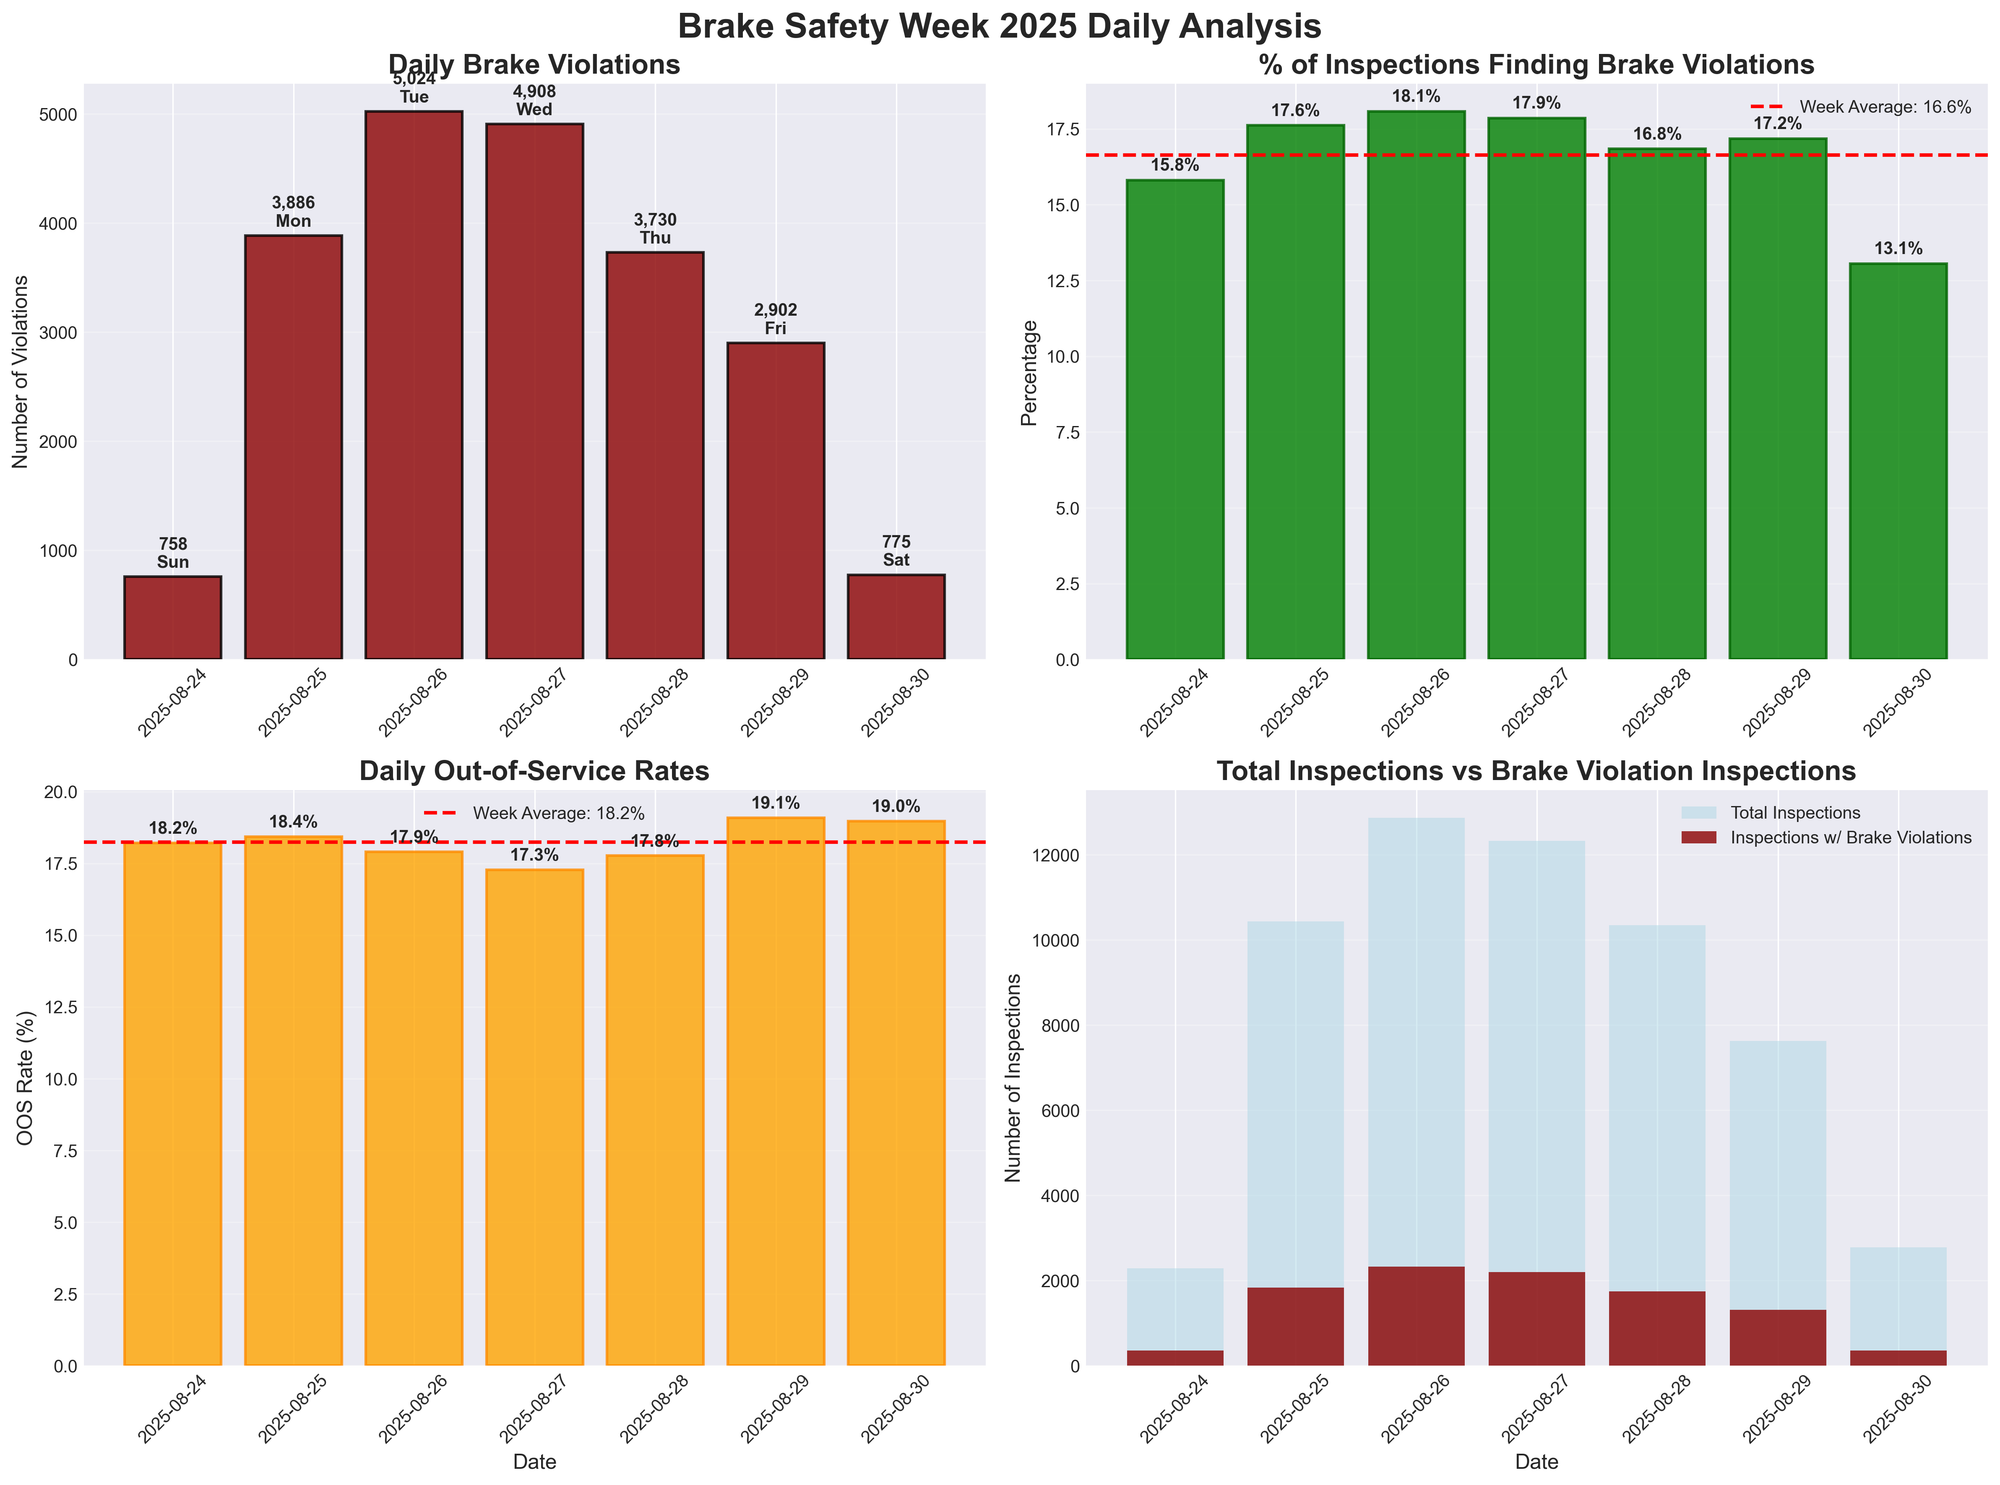
During the week, 10,145 unique inspections found brake violations. This means 16.6% of inspections conducted during Brake Safety Week identified at least one brake violation, compared to the historical rate of 13.9%.
Out-of-Service Rates
Of the 21,983 violations found, 3,995 resulted in vehicles being placed out of service—an 18.2% OOS rate. This is lower than the historical average OOS rate of 20.1% for brake violations.
Daily OOS rates during the week ranged from 17.3% to 19.1%, remaining relatively consistent throughout the enforcement period.
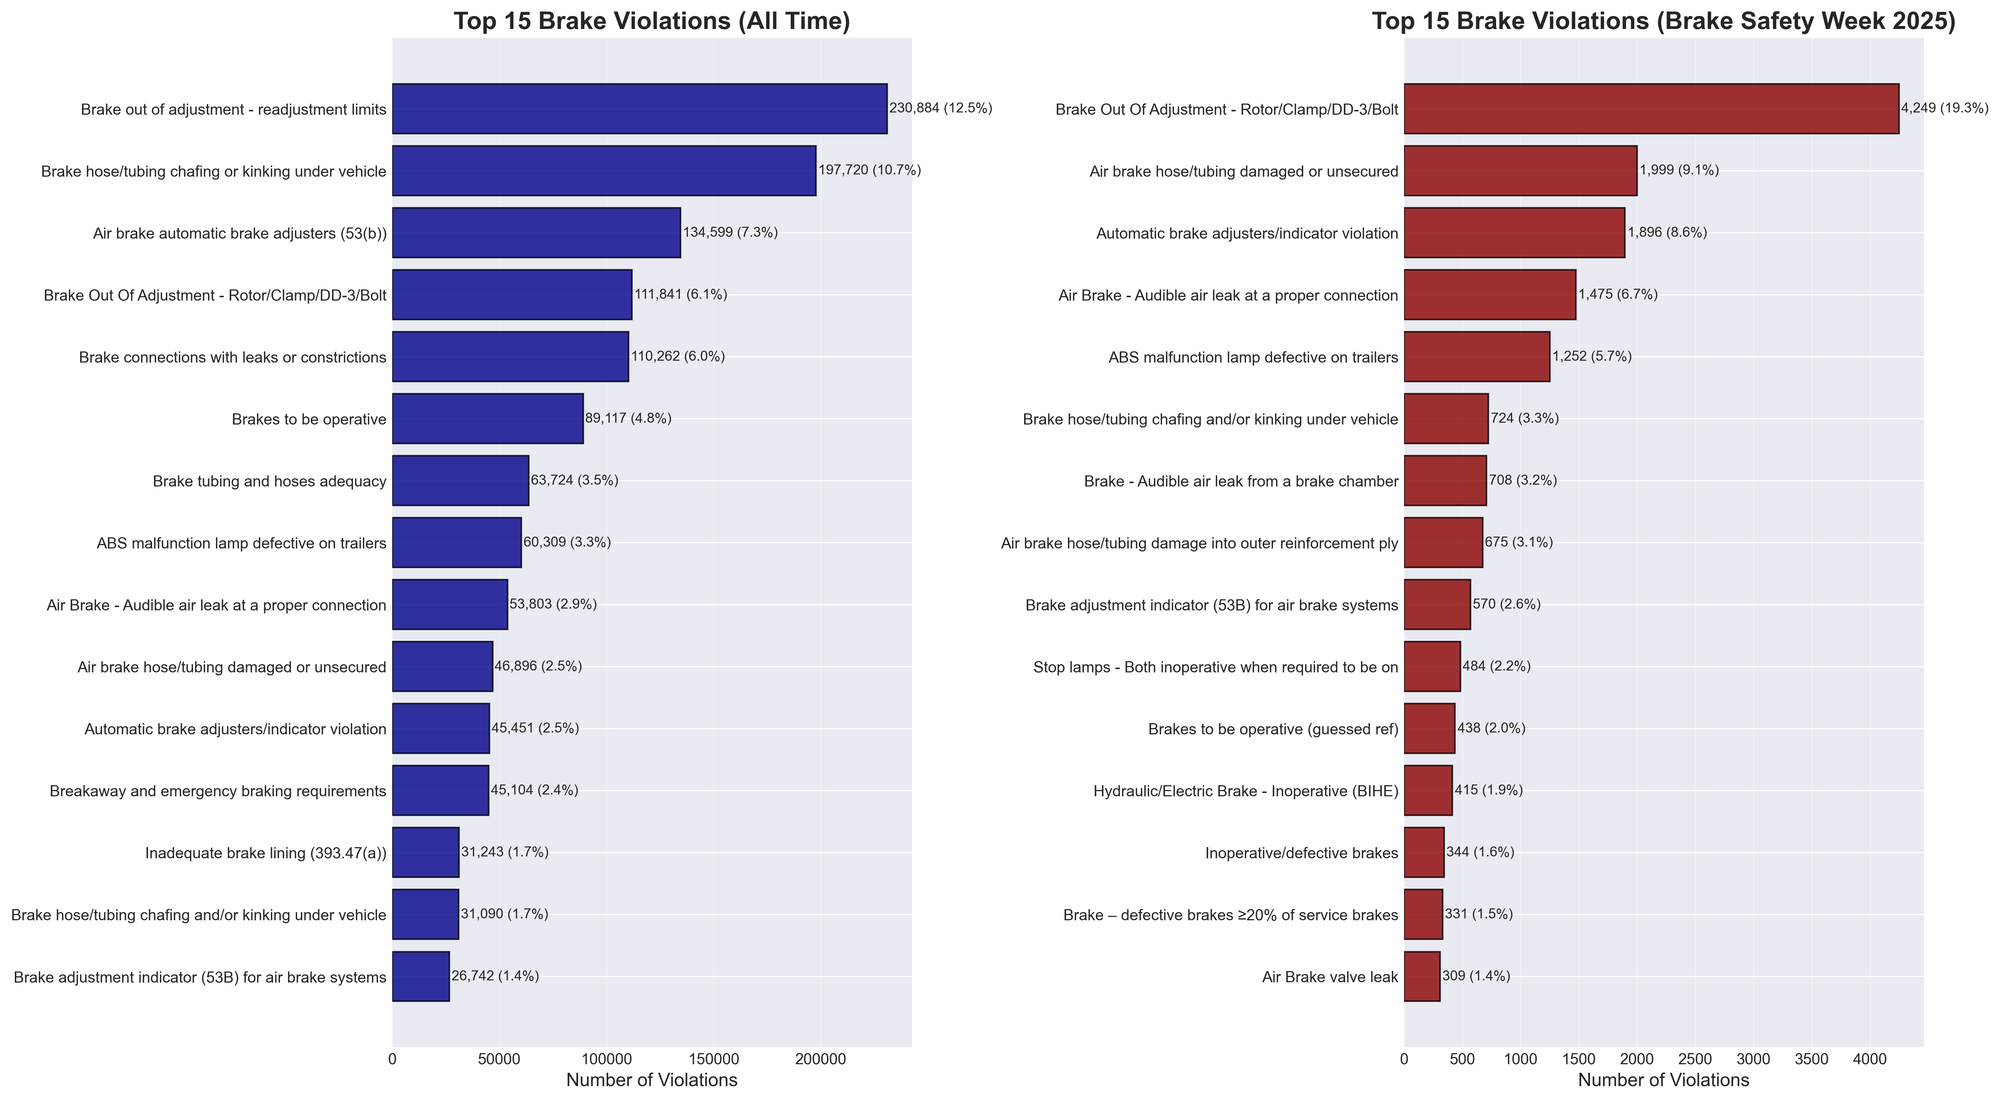
Most Common Violations
The top five violation categories during Brake Safety Week 2025 were:
- Brake Out of Adjustment (393.47E) - 4,249 violations (19.3% of total)
- Air brake hose/tubing damaged (393.45) - 1,999 violations (9.1%)
- Automatic brake adjusters violation (393.53B) - 1,896 violations (8.6%)
- Audible air leak at connection (393.45D) - 1,475 violations (6.7%)
- ABS malfunction lamp defective (393.55E) - 1,252 violations (5.7%)
These five categories accounted for 49.4% of all violations during the week.
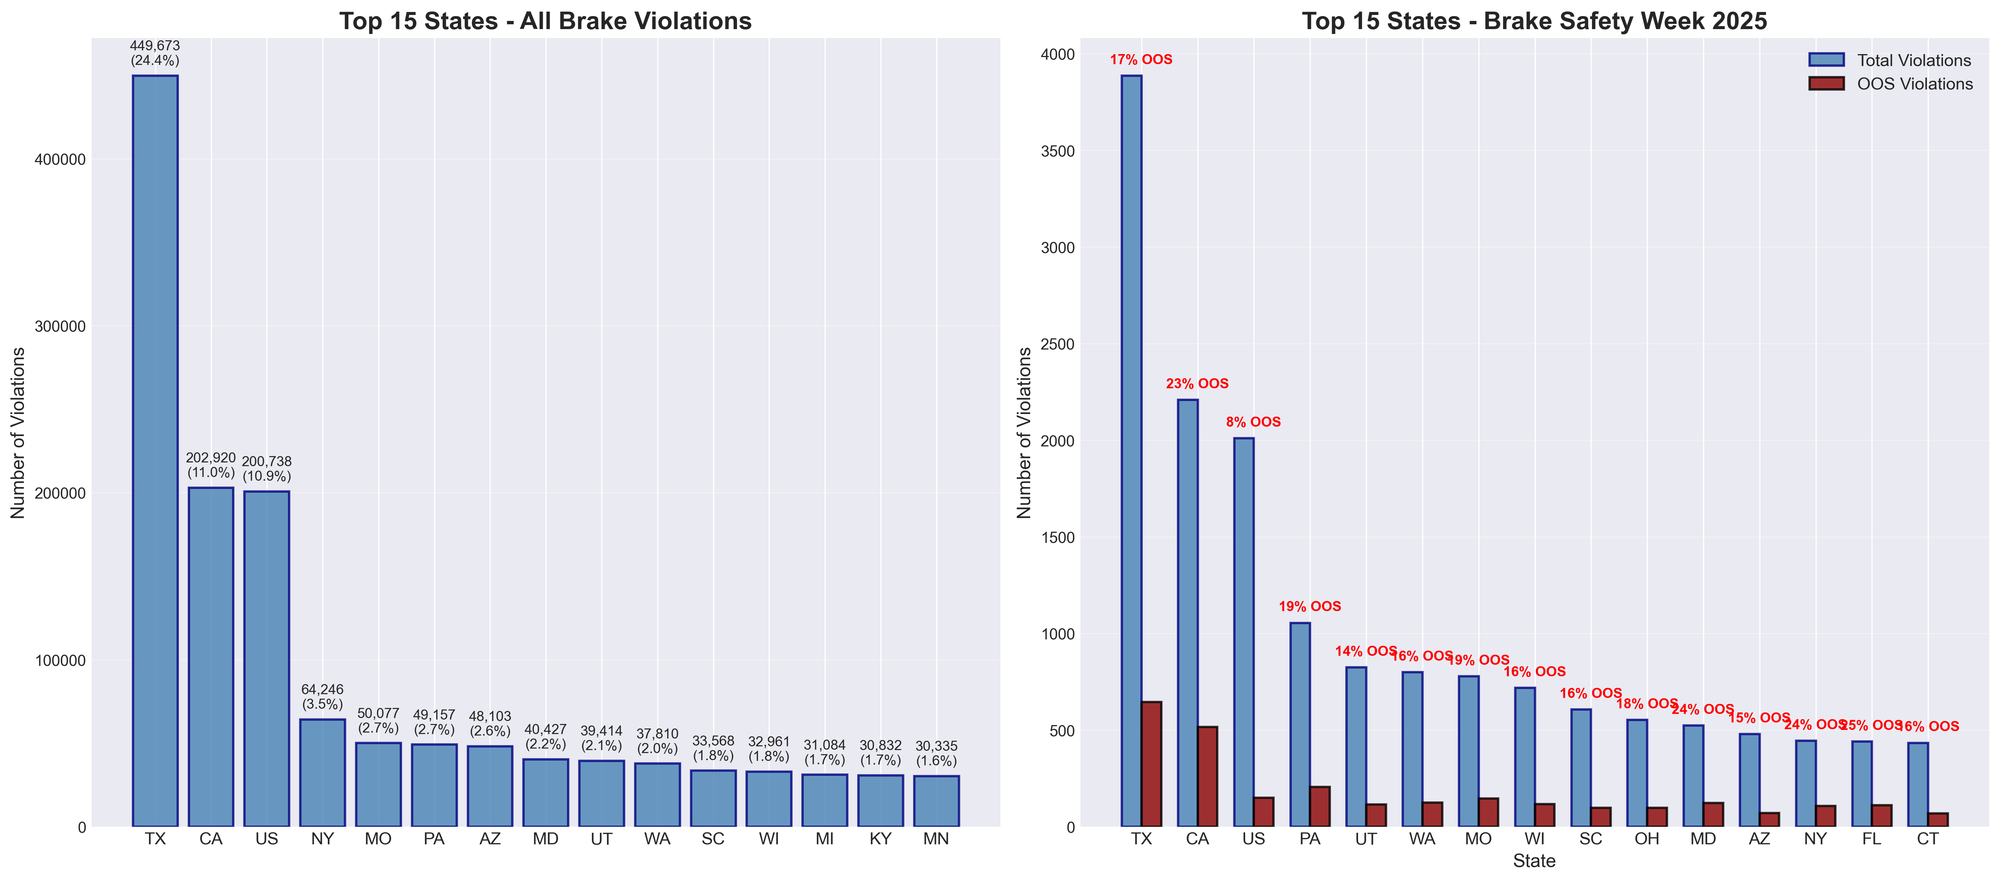
Geographic Breakdown
Texas recorded the most violations with 3,882 (17.7% of total), followed by California with 2,211 (10.1%), and federal inspections with 2,002 (9.1%). Pennsylvania and Utah rounded out the top five with 1,102 and 881 violations respectively.
California had the highest OOS rate among major states at 23%, while federal inspections showed the lowest at 8%. Texas, despite having the most violations, had a 17% OOS rate.
Historical Context
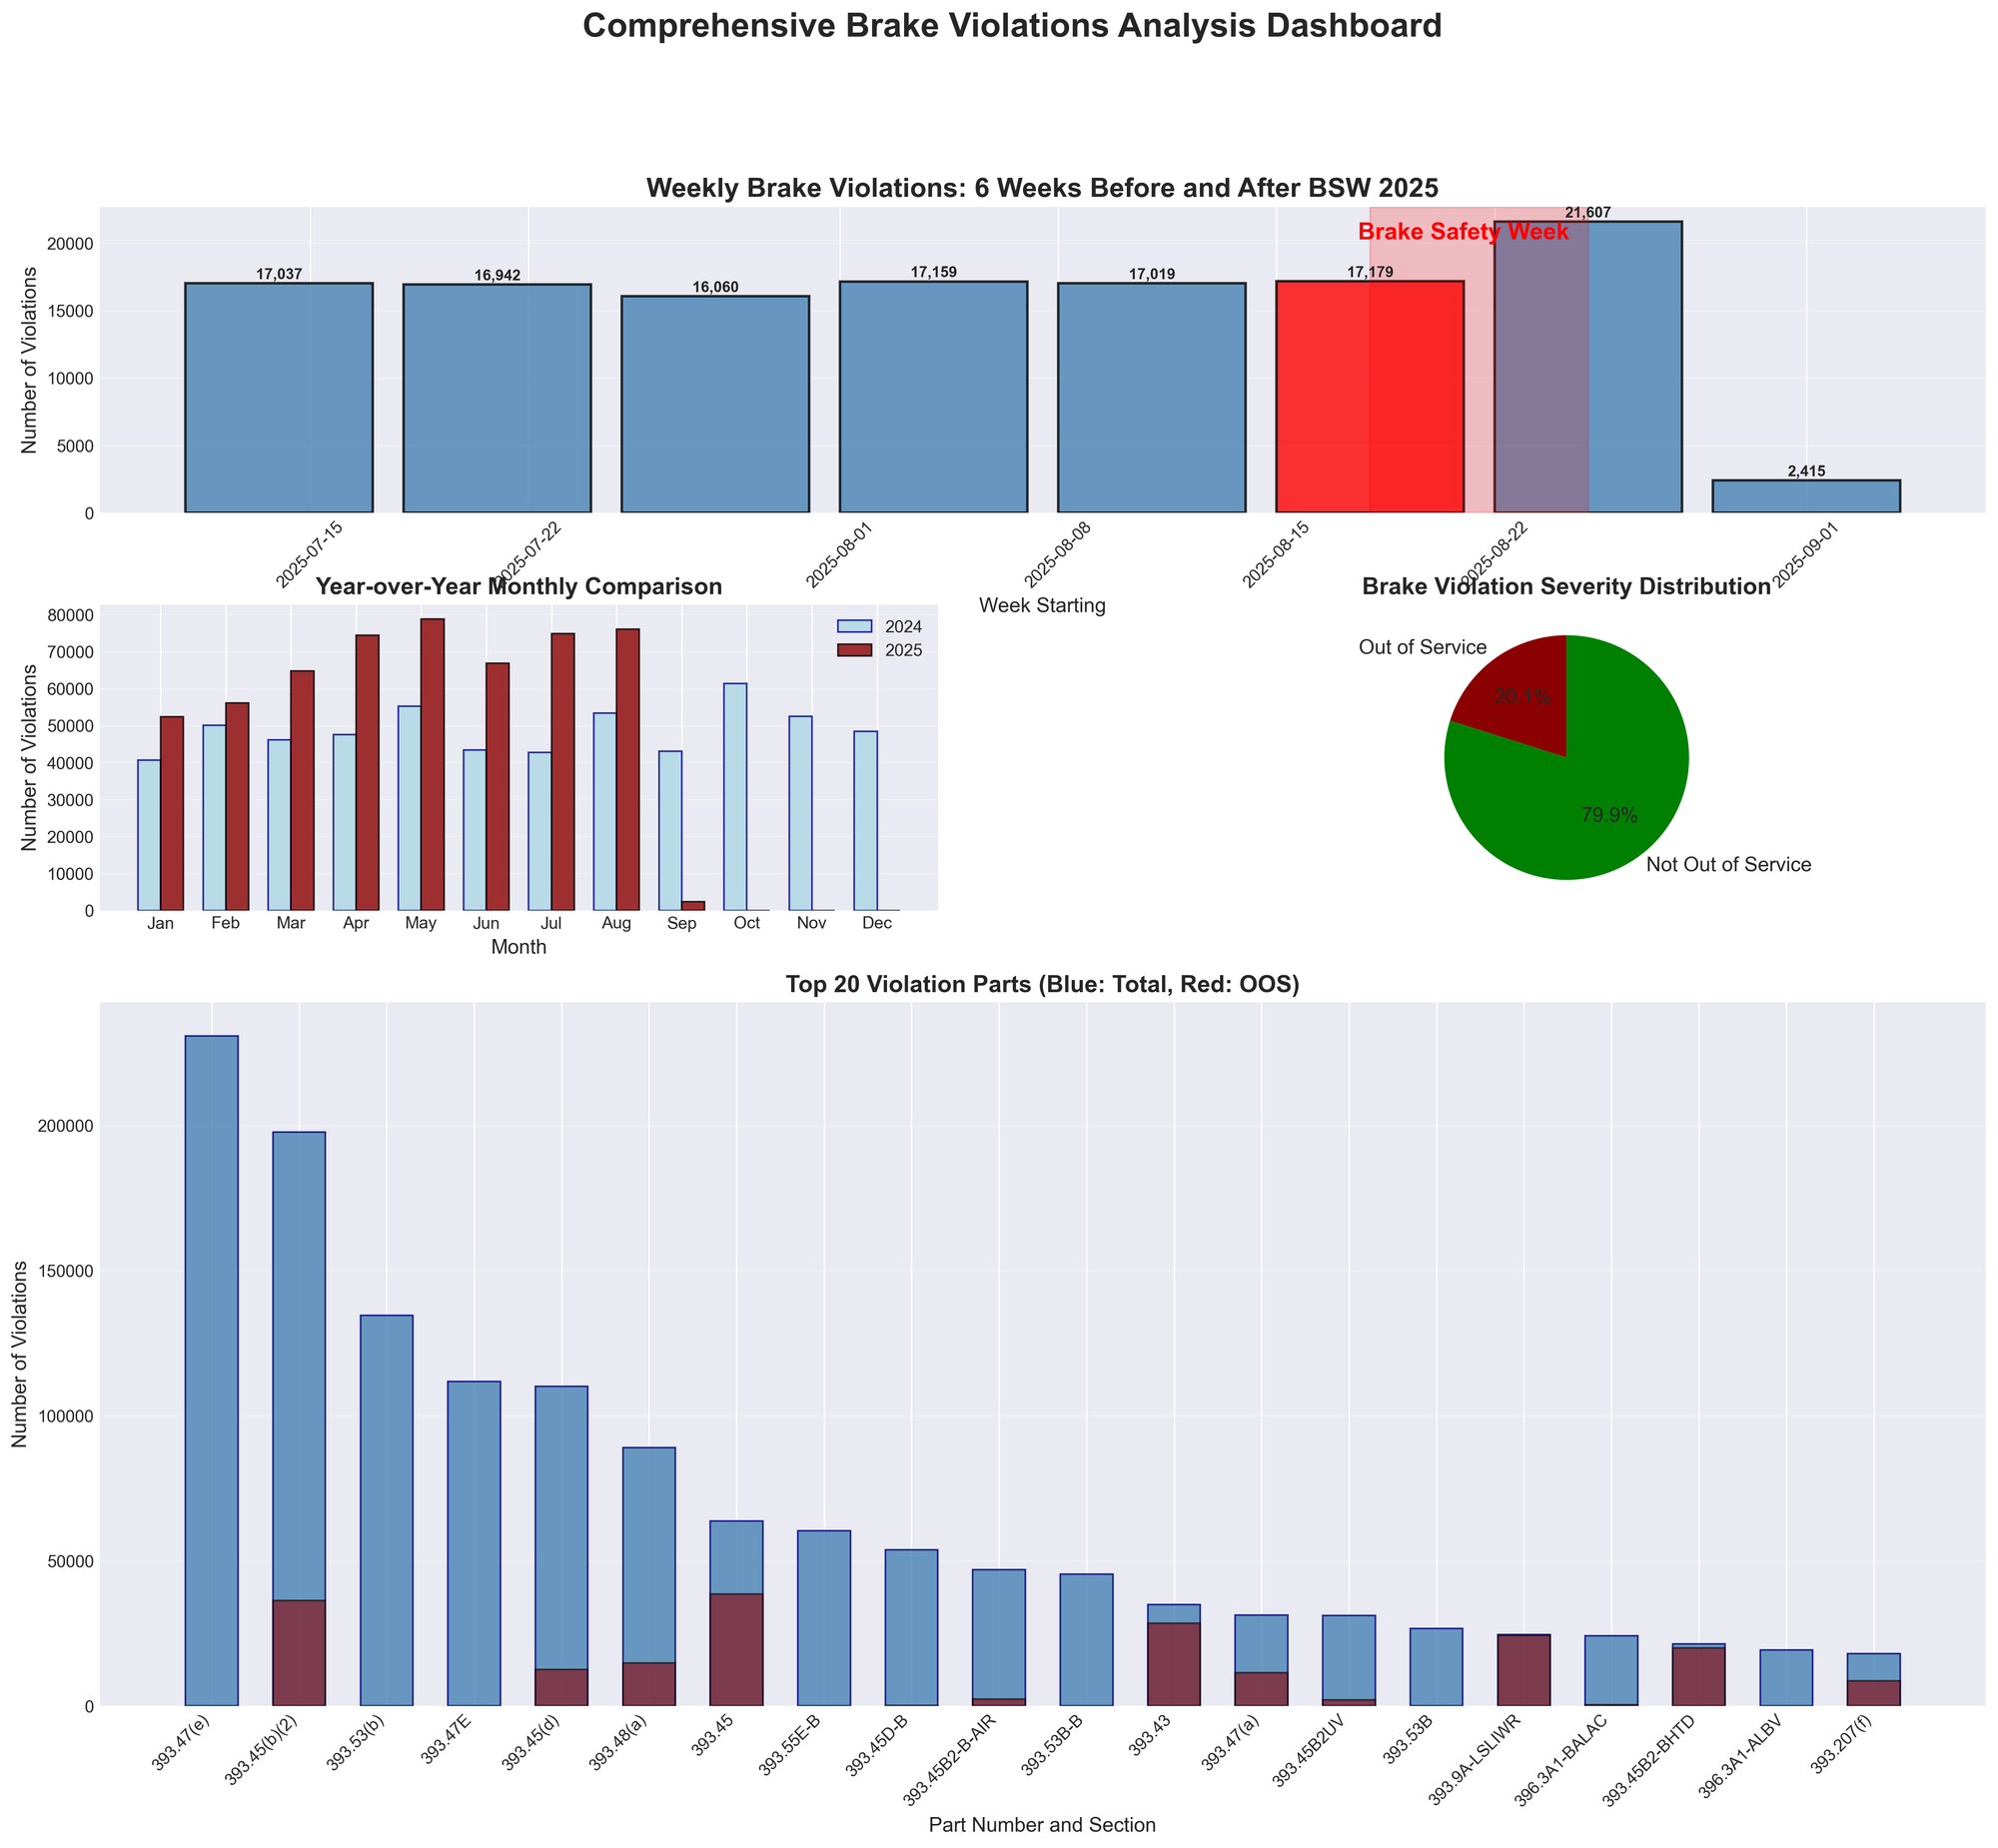
Brake violations have been trending upward over the past three years. Monthly violations now average 59,101, compared to 45,808 in the previous 12-month period—a 29% increase year-over-year.
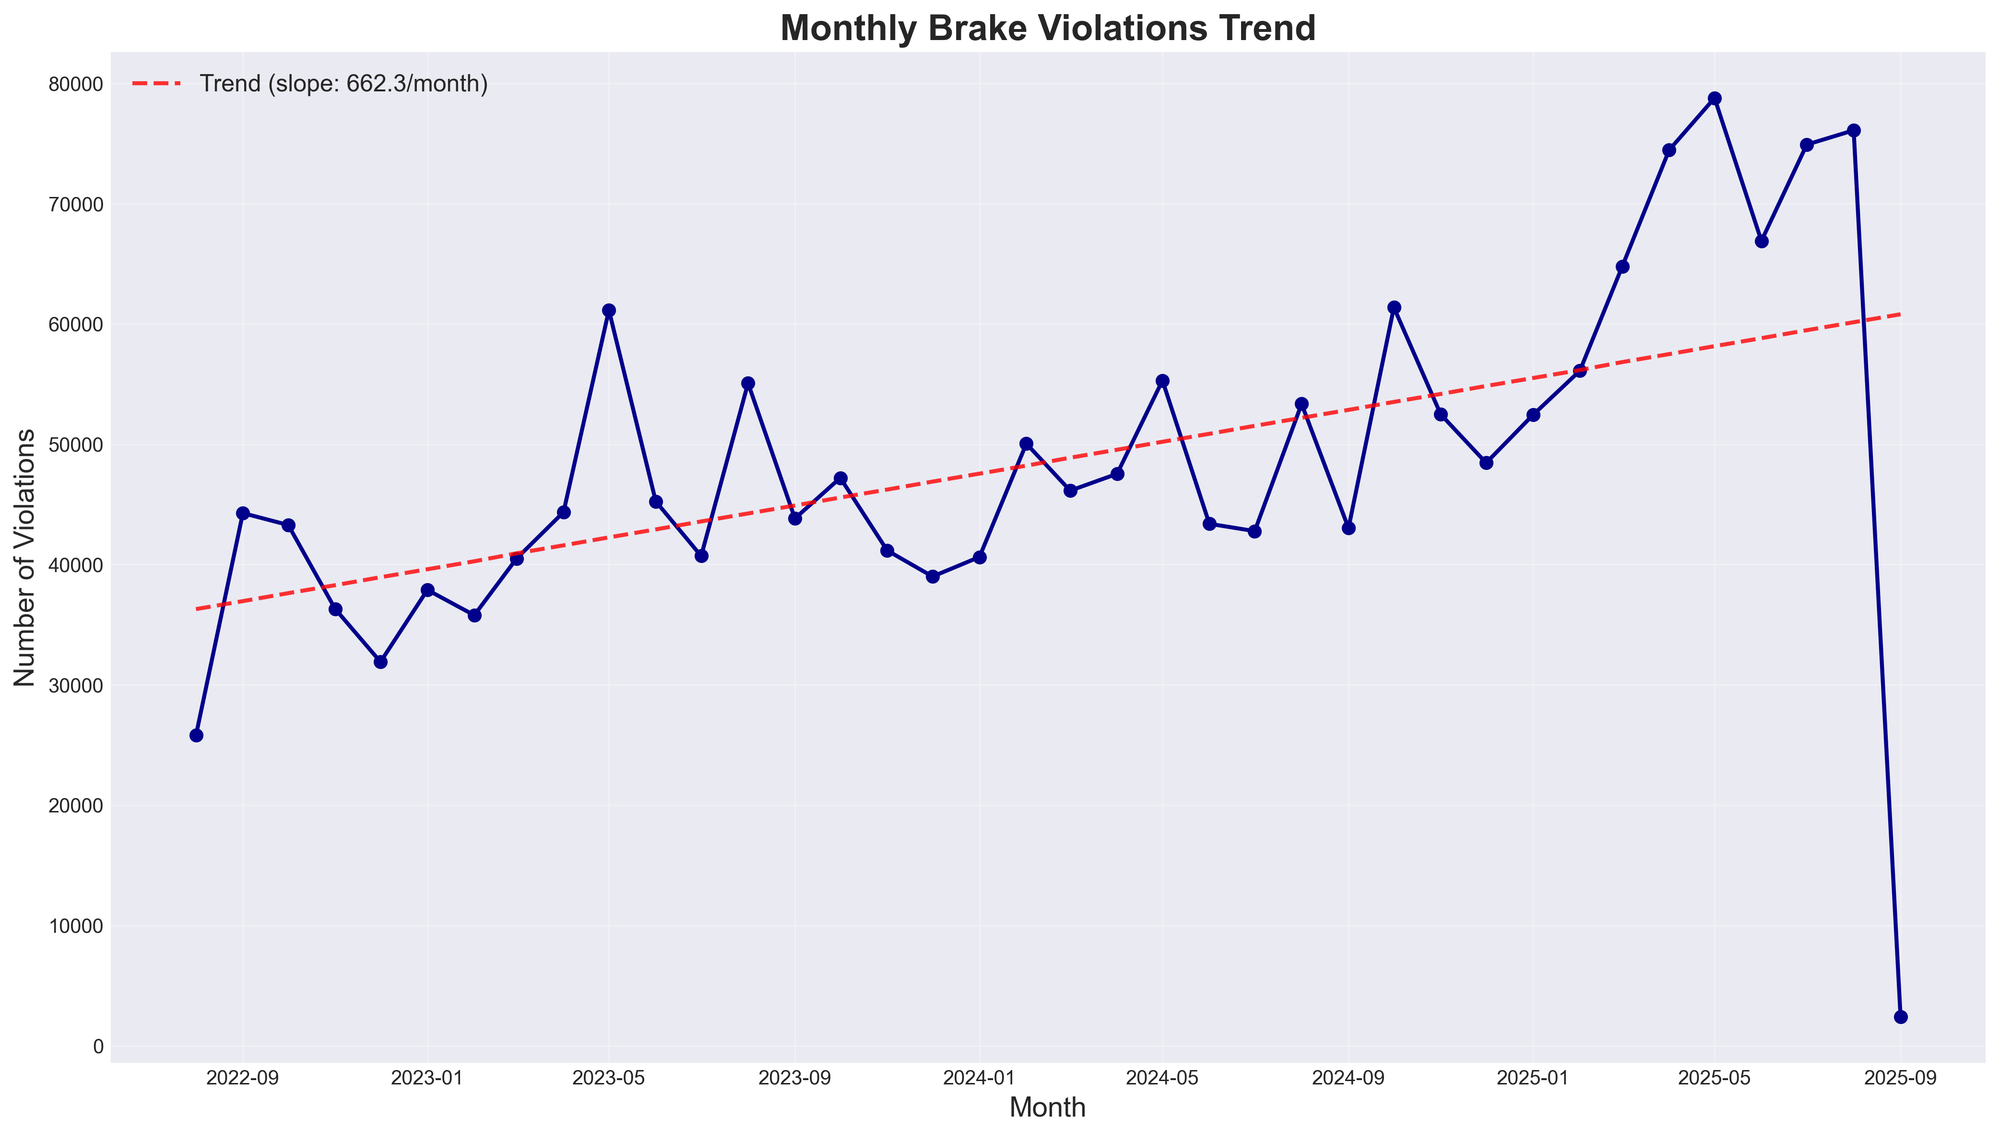
The long-term data shows brake violations growing by an average of 662 violations per month. August 2025, even before Brake Safety Week, recorded 75,609 total violations, continuing this upward trend.
Over the past three years, 968,865 unique inspections have found brake violations, representing approximately 11.6% of all commercial vehicle inspections. The overall OOS rate during this period has remained steady at 20.13%.
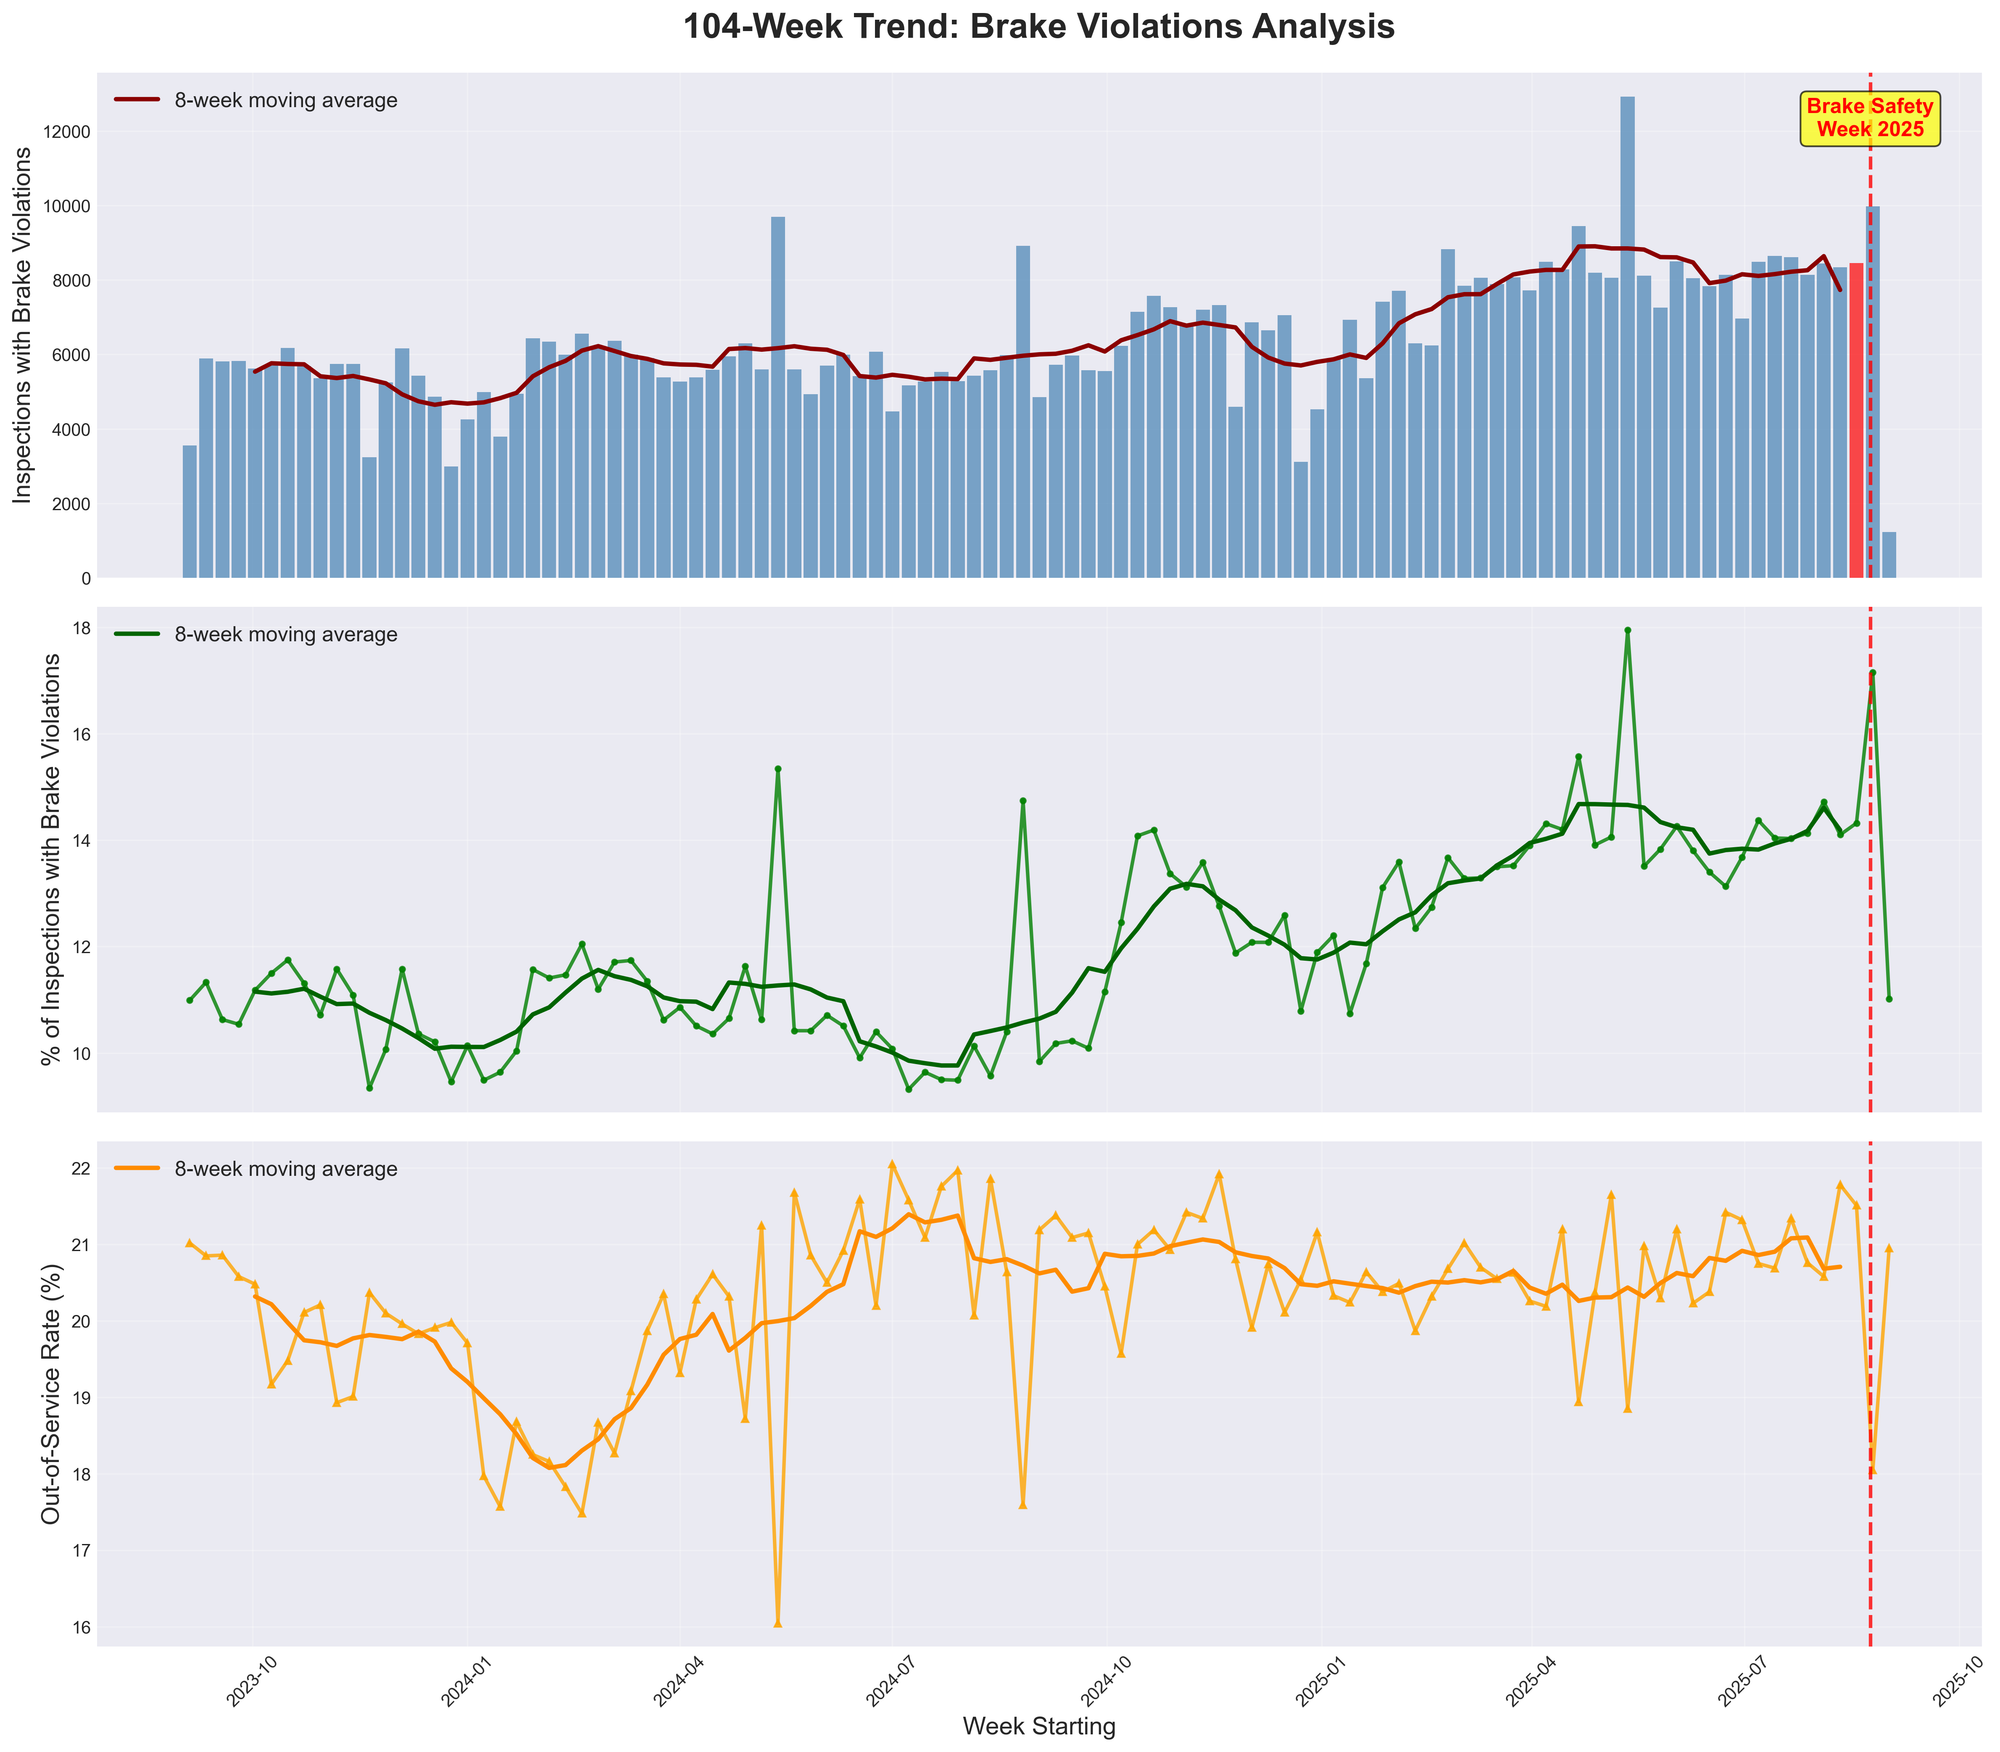
Year-Over-Year Comparison
Brake Safety Week 2025's 21,983 violations represent a ~60% increase from Brake Safety Week 2024, which recorded approximately 13,500 violations during August 25-31, 2024. This year-over-year increase during the focused enforcement week significantly exceeds the overall 29% annual increase in brake violations.
The 21,983 violations found during Brake Safety Week 2025 represent:
- The highest single-week brake violation count in the 104-week dataset
- Approximately 1.2% of annual violations despite representing 1.9% of the year
Violation Types Shift
Brake Safety Week showed a notable shift in violation types compared to historical patterns. "Brake out of adjustment" violations jumped to 19.3% of all violations during the week, compared to 12.5% historically—a 54% relative increase in this category's proportion.
Conversely, air brake hose/tubing issues dropped to 9.1% during the week from 10.7% historically. This shift toward adjustment-related violations during Brake Safety Week suggests inspectors may be performing more thorough brake adjustment checks during the focused enforcement period.
Weekend Effect
The week saw significant variation in daily enforcement, with weekday violations averaging 4,086 compared to weekend averages of 767—an 81% difference. This pattern reflects inspection staffing levels rather than changes in vehicle brake conditions.