Commercial Vehicle Enforcement Trends: 2022-2024
The Data Behind the Headlines
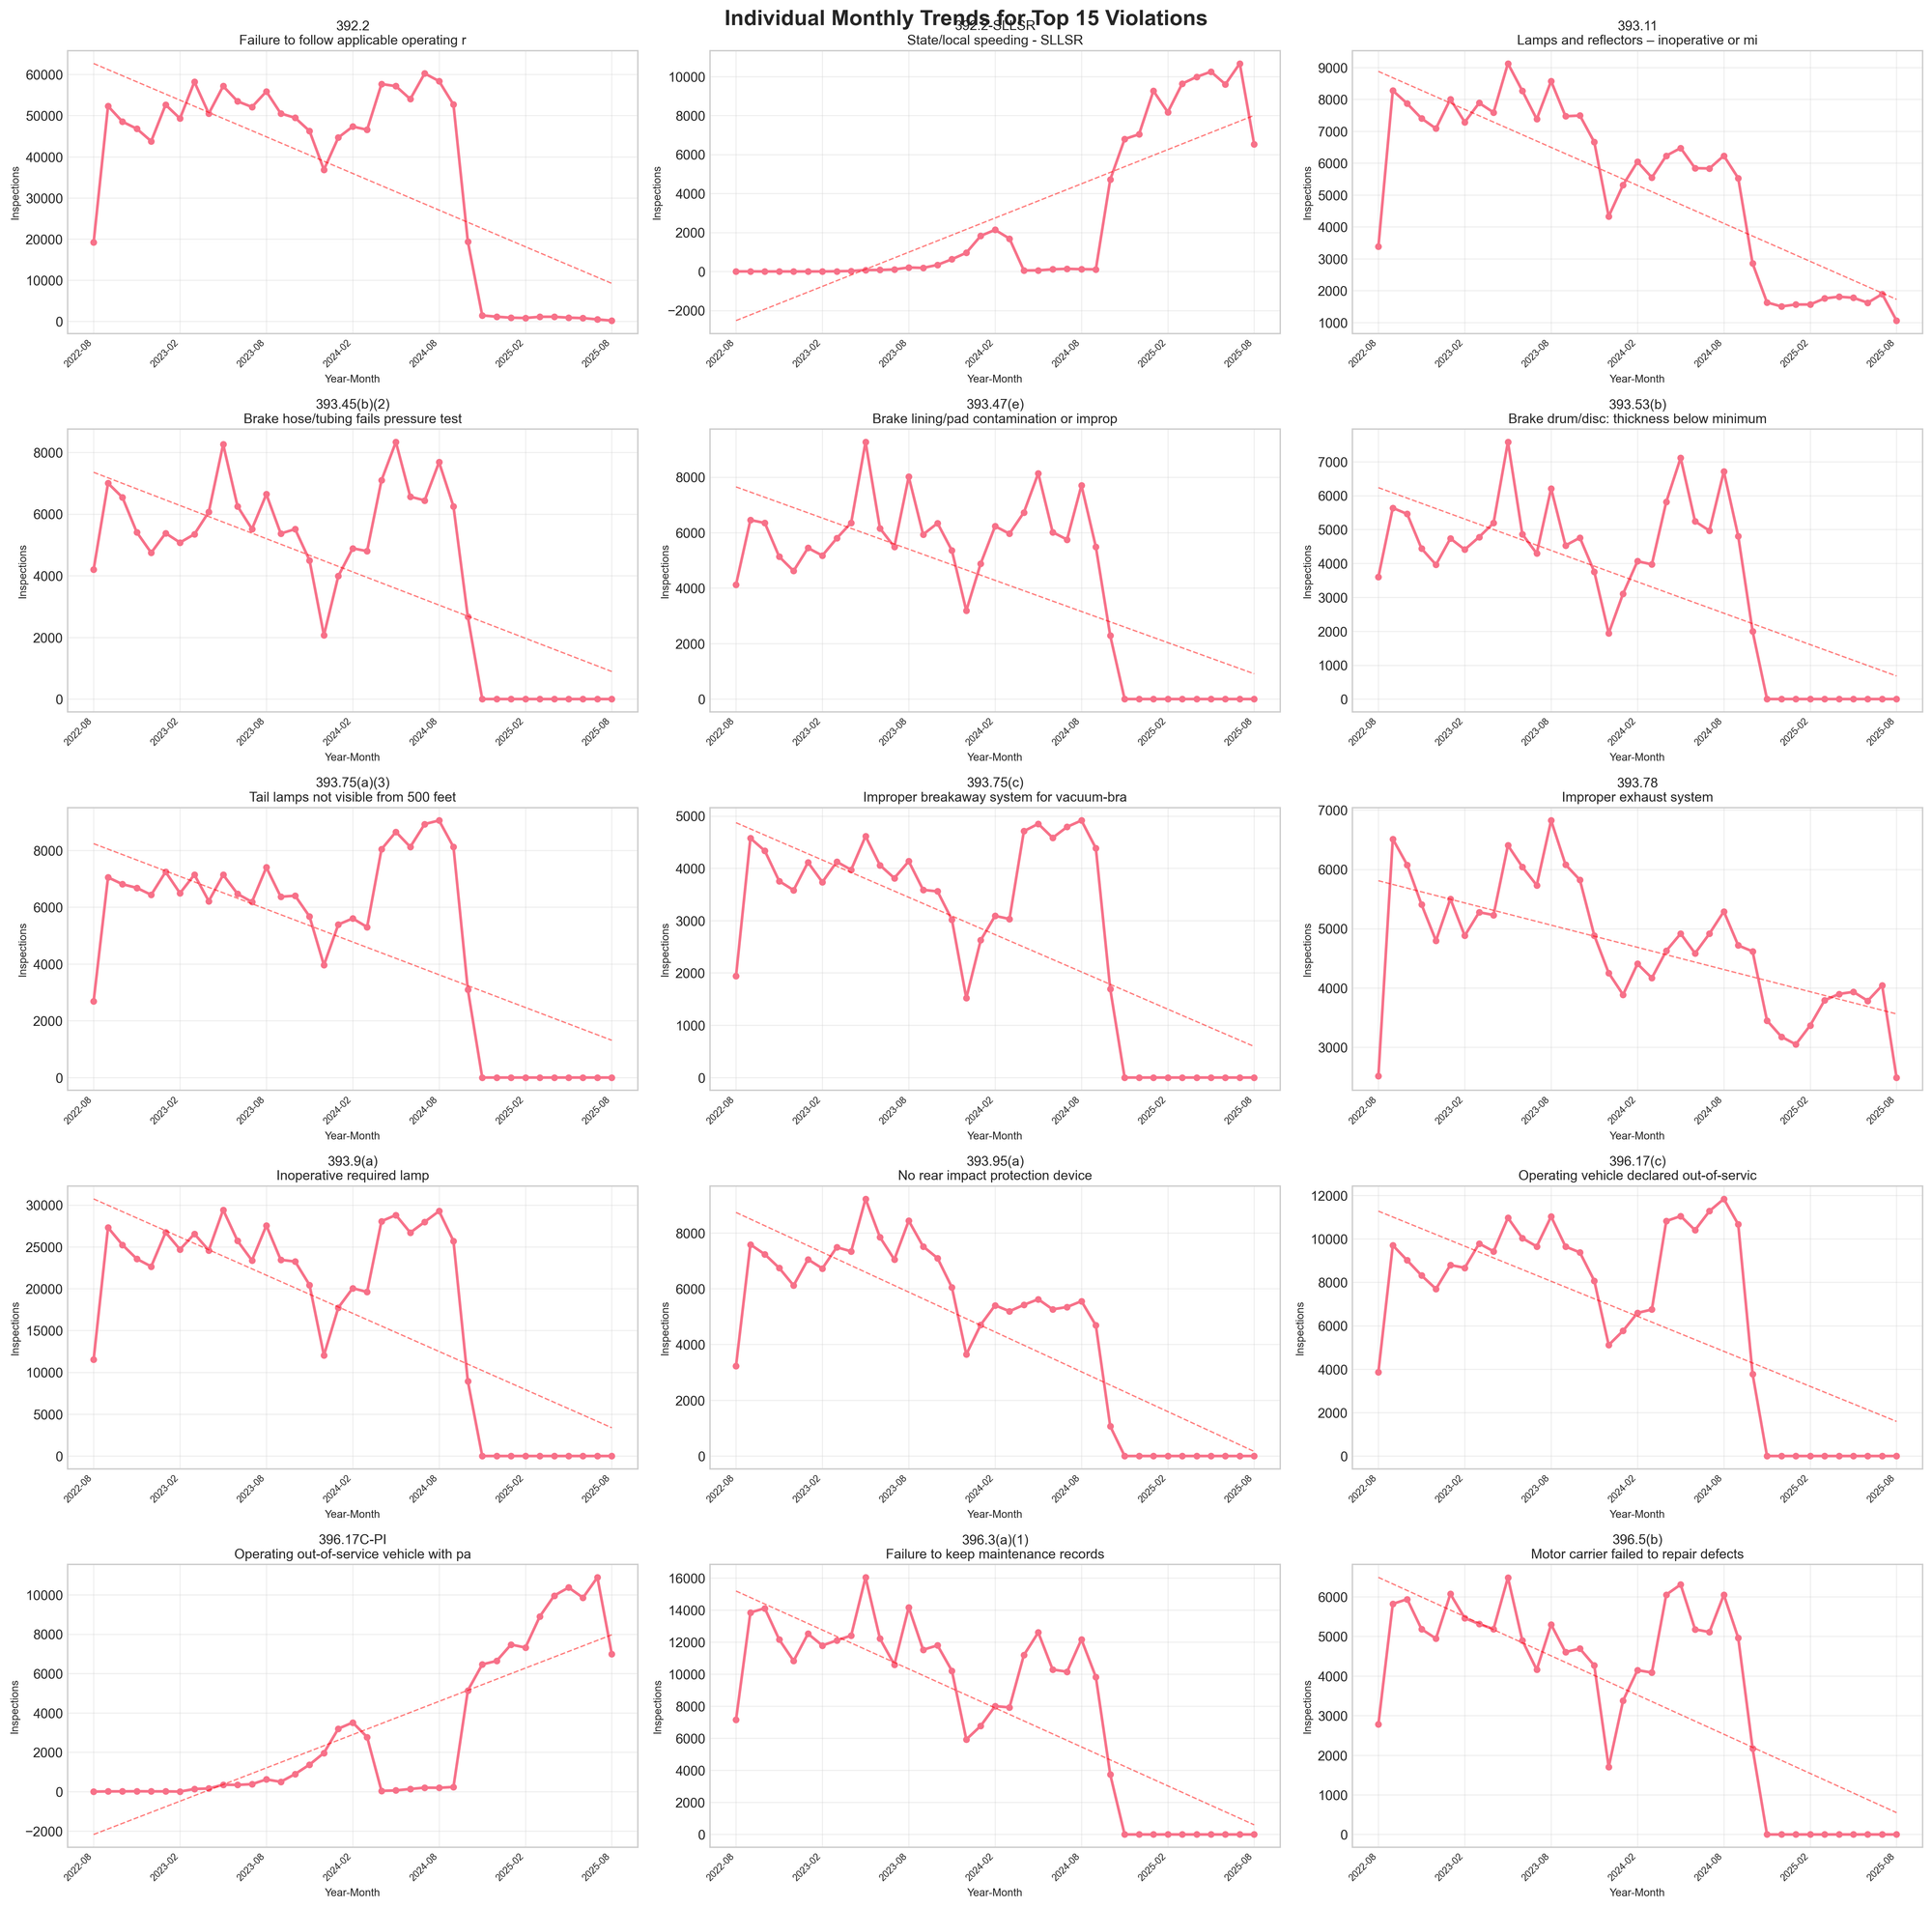
An analysis of 12.9 million commercial vehicle violations across 4.5 million inspections reveals significant changes in enforcement patterns from August 2022 through August 2024. These shifts reflect evolving regulatory priorities, technological capabilities, and state-level enforcement strategies that are reshaping the compliance landscape.
The most notable finding: state and local speeding violations (392.2-SLLSR) increased from 0.004% to 8.355% of all inspections—a change of over 200,000%. This represents not a statistical anomaly but a fundamental reallocation of enforcement resources.
Understanding the Enforcement Shift
The Rise of State-Level Speed Enforcement
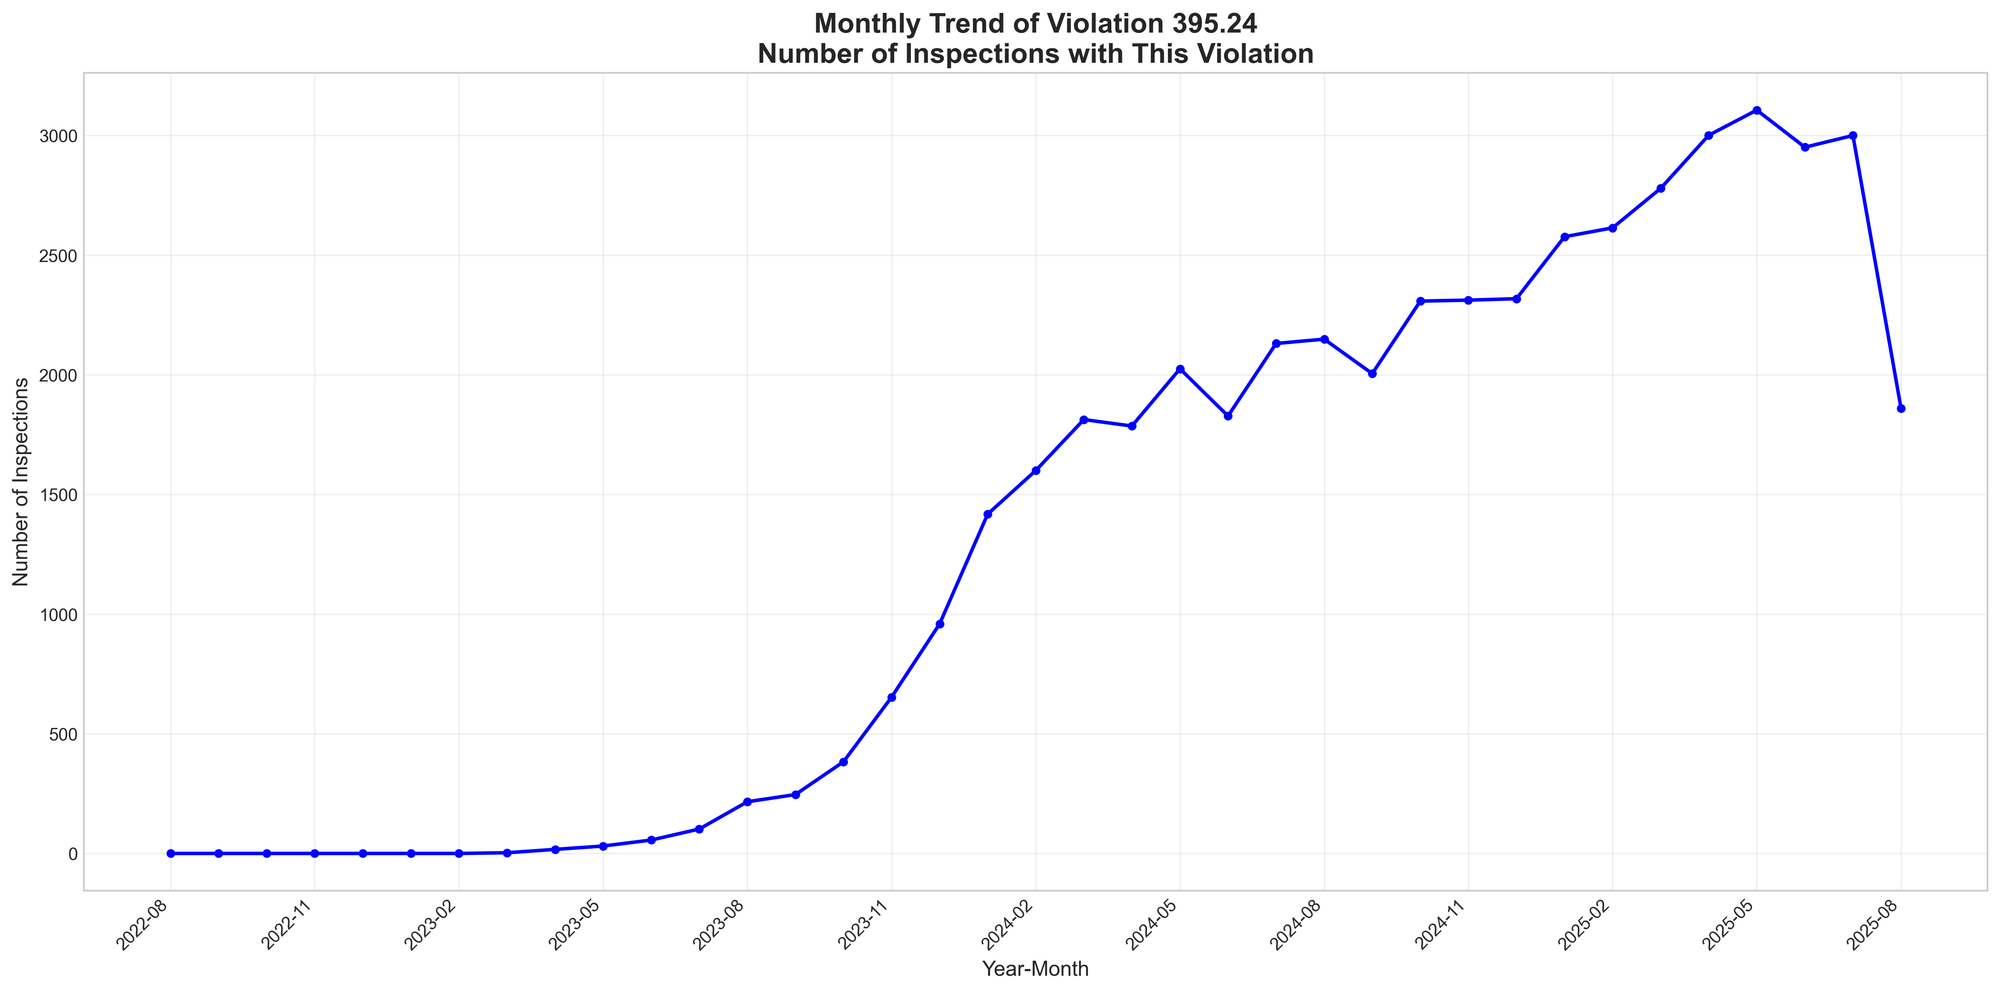
The surge in state/local speeding violations began gradually in early 2023 before accelerating dramatically in 2024. Monthly averages jumped from 24 inspections in the first year to 7,728 in the final year of the analysis period. This timing aligns with multiple state-level enforcement initiatives.
Texas conducted targeted enforcement operations throughout 2024, including a three-day Permian Basin operation in October that yielded 299 speed violations. The state's "Operation Slowdown" ran enforcement activities through August 4, 2024. California authorized automated speed enforcement cameras in multiple cities, fundamentally changing detection capabilities. Florida participated in coordinated southeastern state enforcement efforts.
These weren't isolated initiatives—they represent a coordinated shift toward state-level enforcement that appears to be supplementing, and in some cases replacing, federal enforcement priorities.
Vehicle Maintenance: A Tale of Two Trends
While speeding violations soared, the vehicle maintenance category presents a complex picture. Some violations increased dramatically:
- Operating out-of-service vehicles with passengers: up from 0.006% to 9.762%
- Emergency brake system defects: up from 0.014% to 7.528%
- Inoperative lamps and reflectors: up from 0.033% to 6.889%
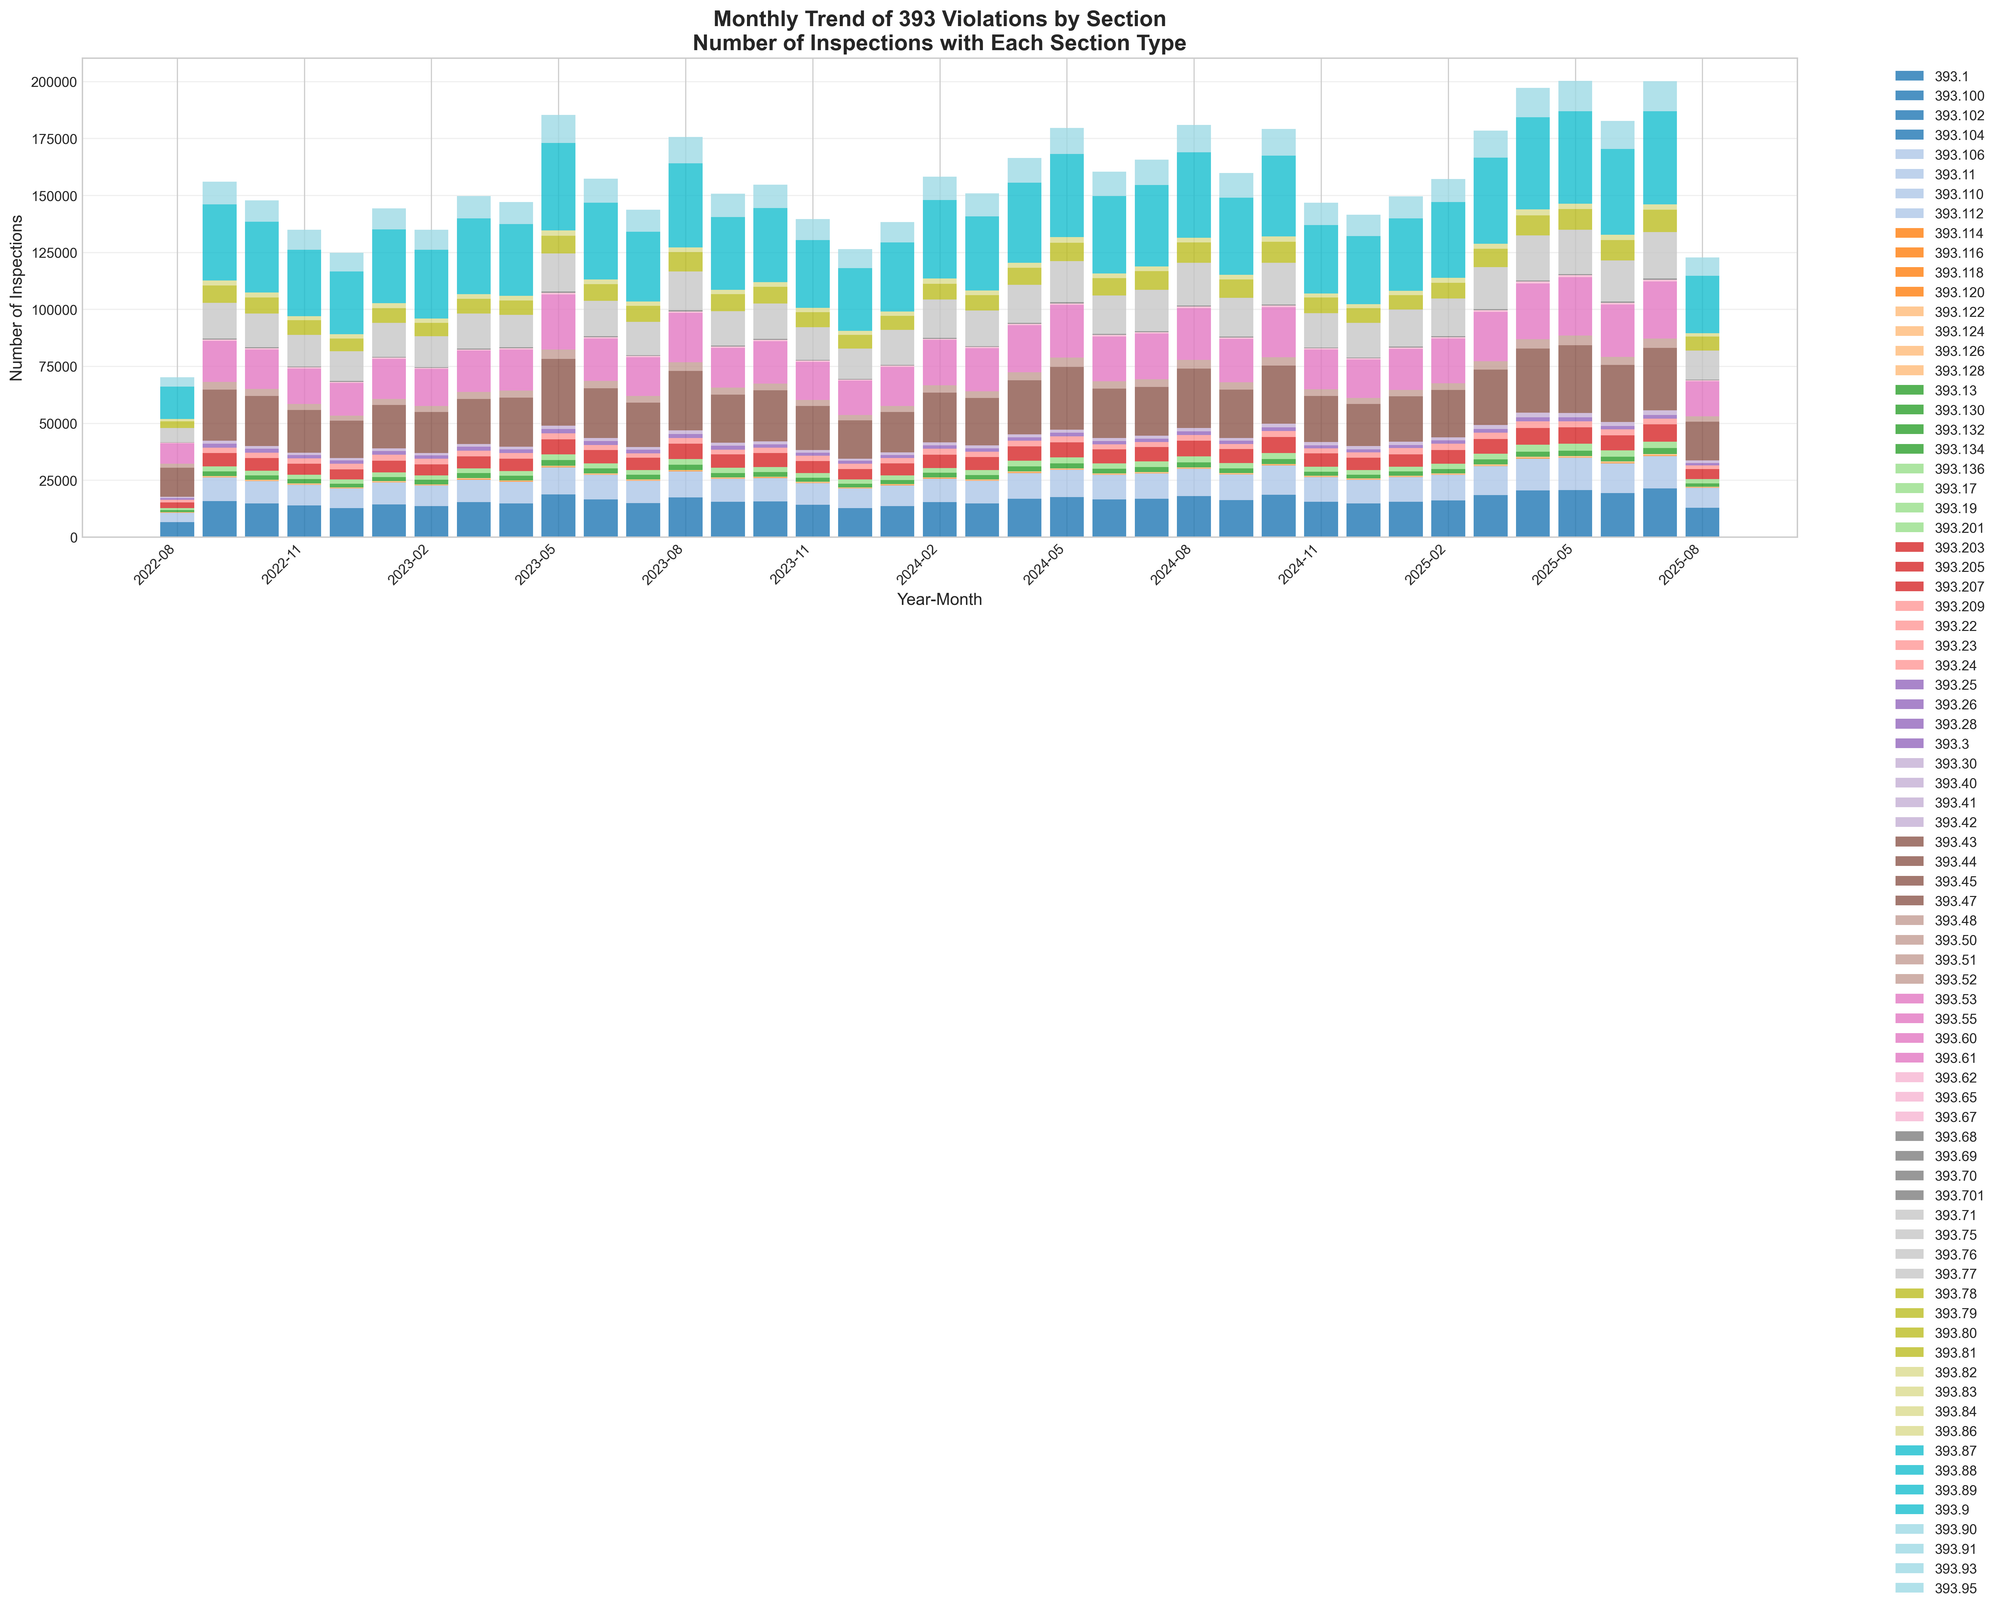
Yet traditional maintenance violations decreased significantly:
- Brake drum/disc thickness violations: decreased to zero
- Brake lining contamination: down 22.0%
- Exhaust system violations: down 24.0%
This divergence suggests inspectors are focusing on immediately observable violations rather than conducting thorough mechanical inspections—a shift that may reflect resource constraints or changing enforcement priorities.
Geographic Patterns Tell Their Own Story
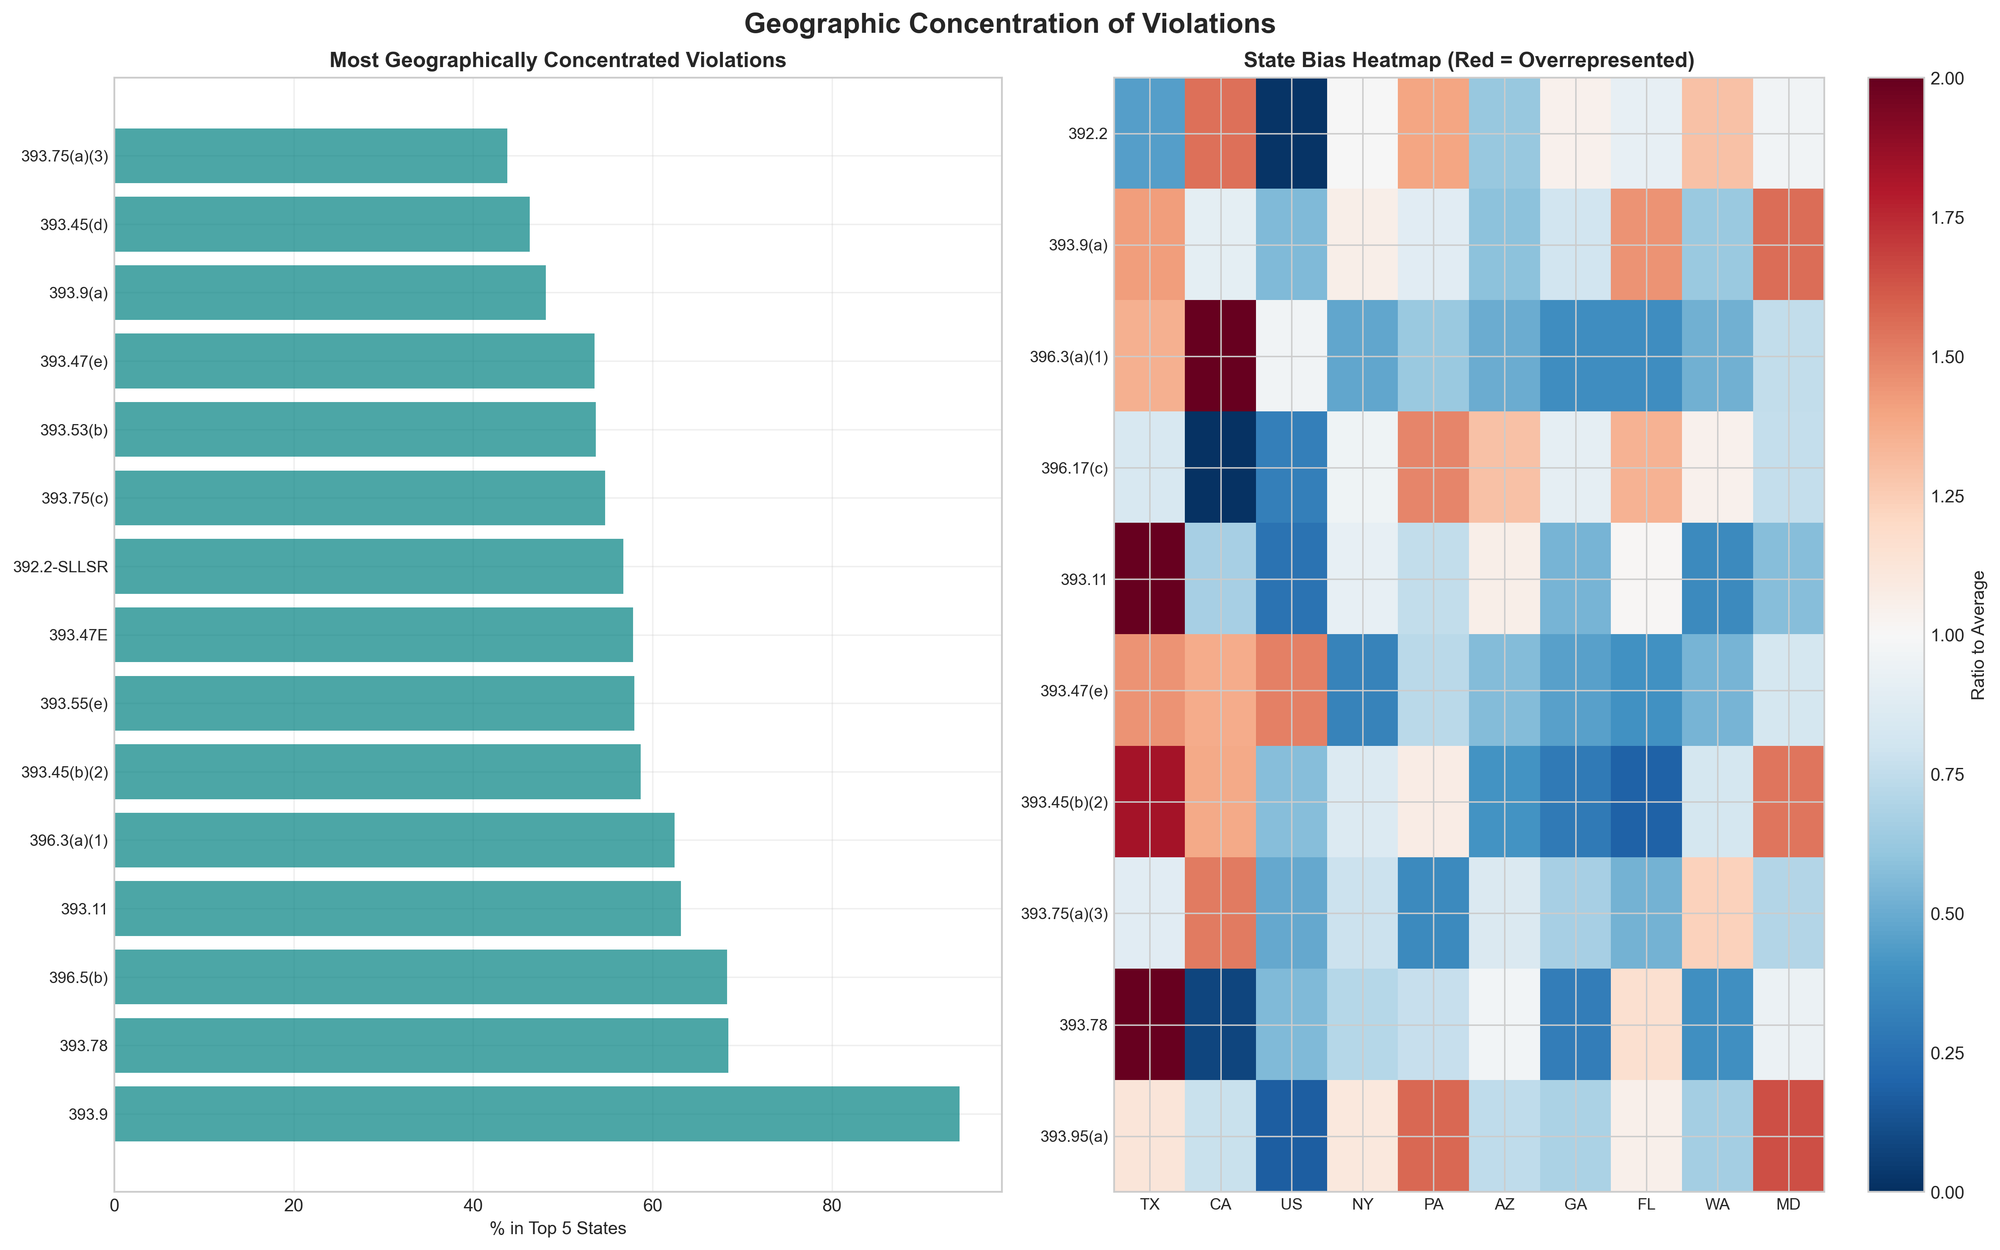
The geographic distribution of violations reveals strong state-level enforcement patterns. Texas leads in multiple categories, with violations rates far exceeding national averages:
- Inoperative lamp violations: 4.6x the national average
- Improper exhaust systems: 2.9x the national average
- Vehicle maintenance defects: 2.2x the national average
Alabama shows similar concentration in exhaust system violations (3.0x average) and rear impact protection devices (2.2x average). California's enforcement focuses heavily on speeding (3.6x average) and maintenance record violations (2.9x average).
This geographic concentration—with the top five states accounting for over 50% of violations in many categories—indicates that enforcement experiences vary dramatically based on location. A carrier operating primarily in Texas faces a fundamentally different compliance environment than one based in the Northeast.
Fleet Size Matters
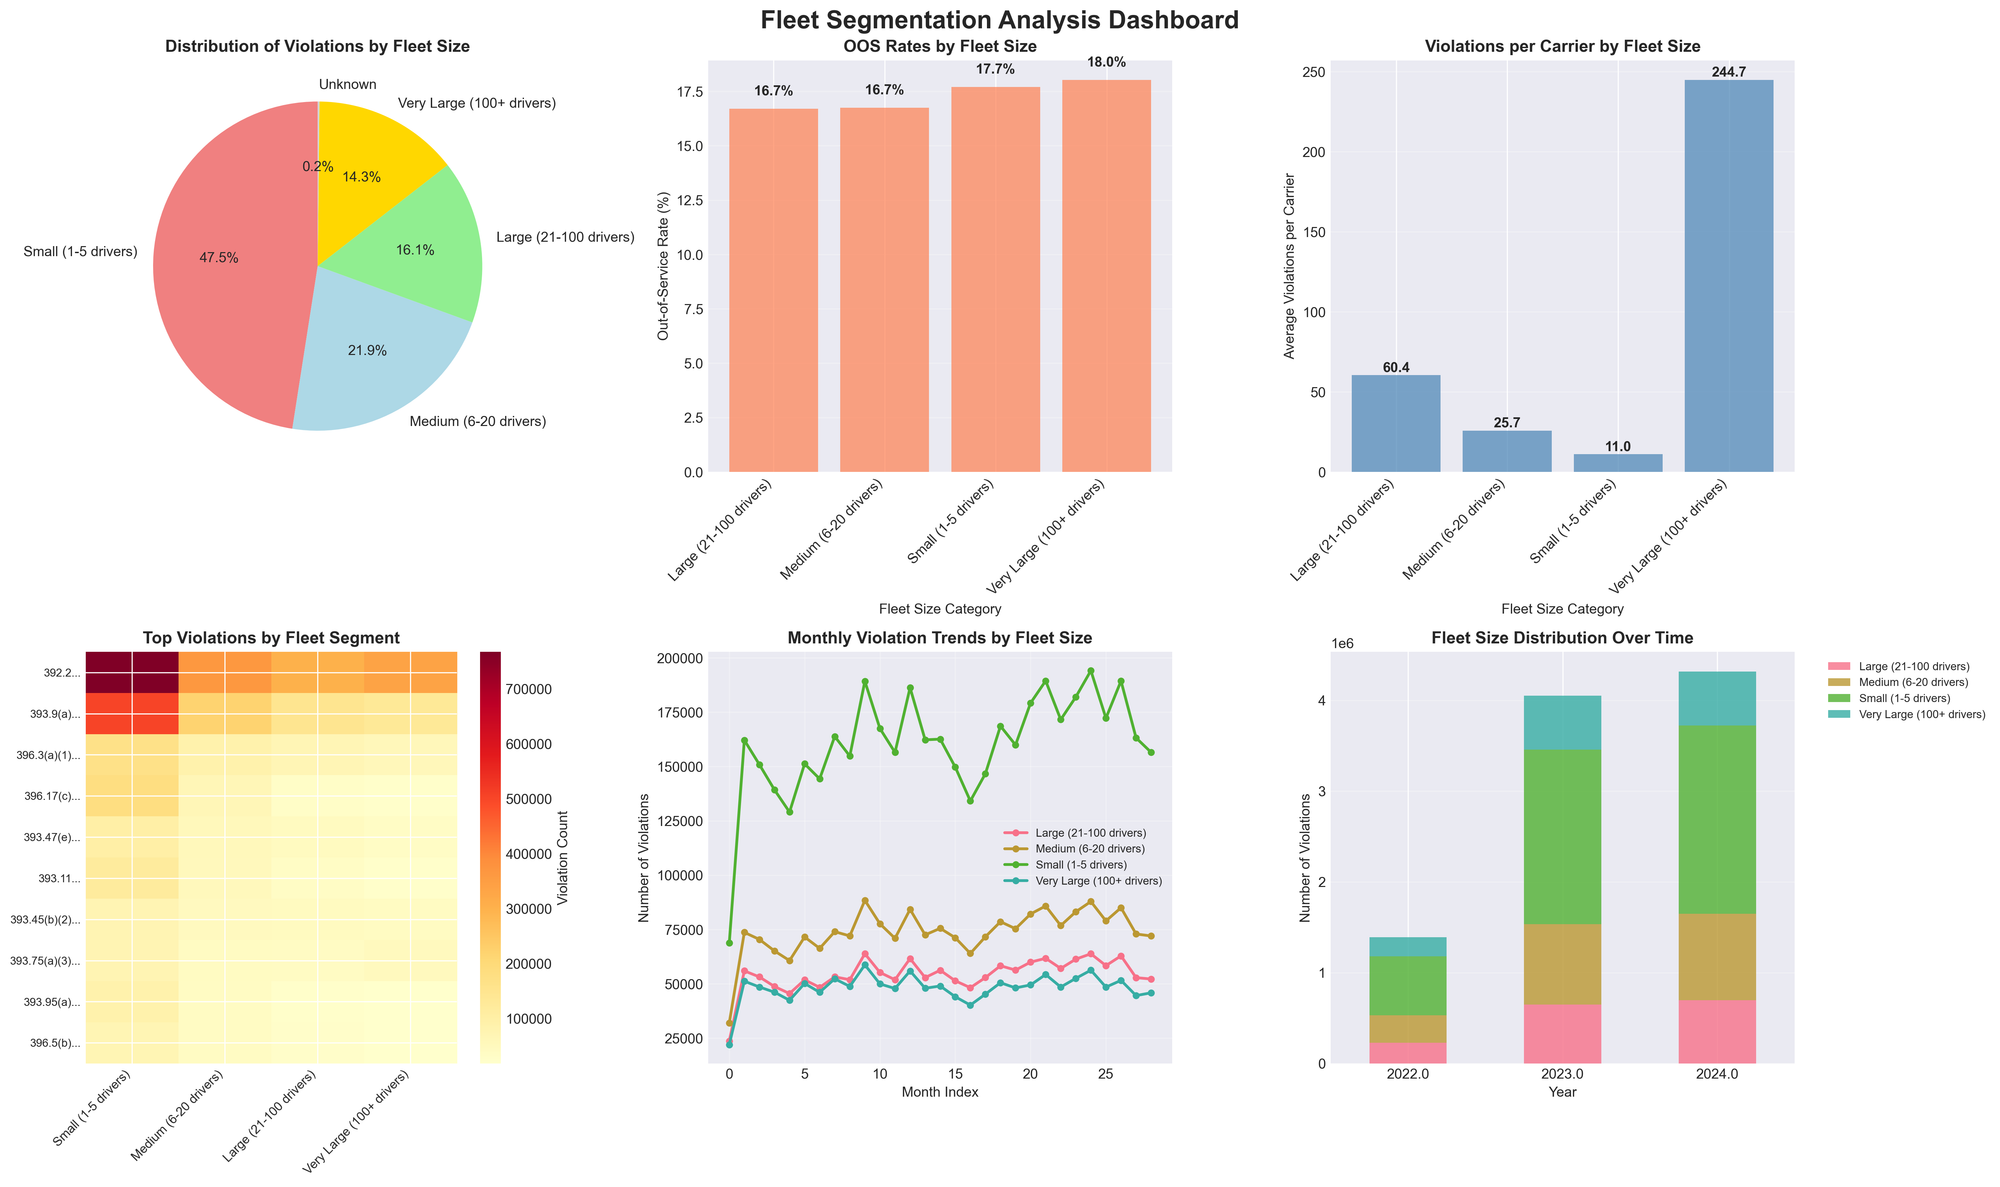
The data reveals distinct patterns based on fleet size:
- Small fleets (1-5 drivers) show consistent out-of-service rates around 16.7%
- Medium fleets (6-20 drivers) experience higher rates of speeding and out-of-service violations
- Large fleets (21-100 drivers) maintain relatively stable violation patterns
- Very large fleets (100+ drivers) see more brake and securement violations
These patterns suggest that enforcement may be targeting different fleet segments strategically, or that compliance capabilities vary significantly by organization size.
Seasonal Enforcement Cycles
Strong seasonal patterns emerge across violation types:
- March shows peaks for speeding and out-of-service violations
- Summer months (June-August) see increased brake-related violations
- December brings the highest rates for lamp violations
- September consistently shows the lowest enforcement activity
These cycles appear to reflect planned enforcement campaigns rather than random variation, suggesting carriers could anticipate and prepare for seasonal enforcement focus areas.
Year-Over-Year: The 2024 Transformation
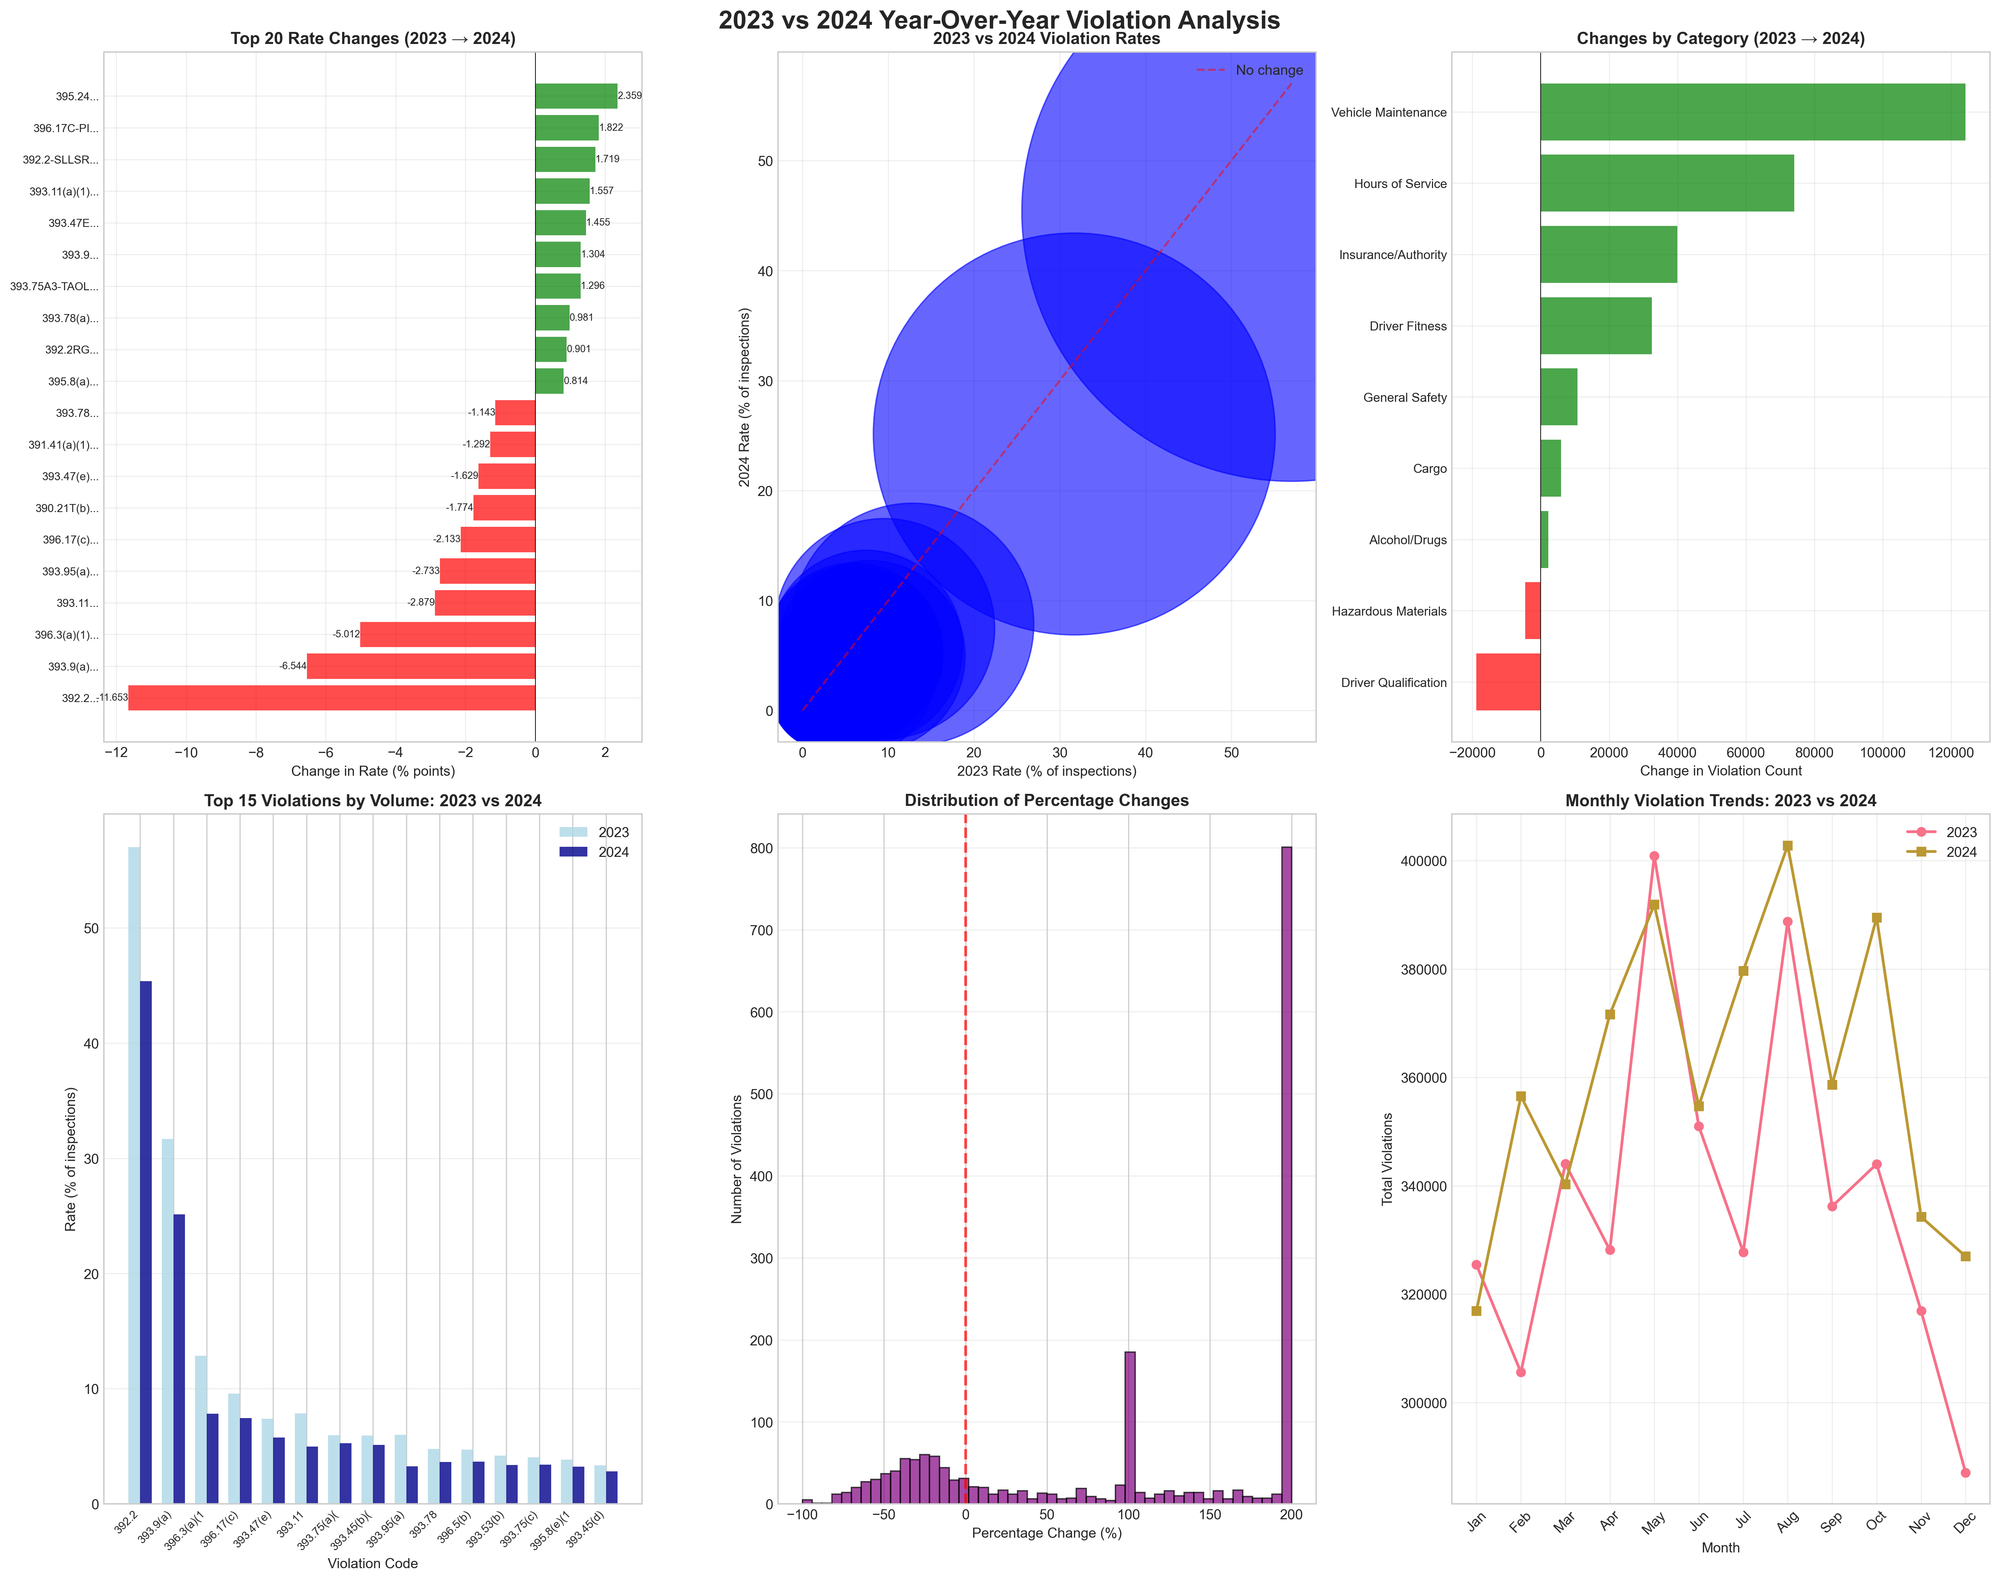
The transition from 2023 to 2024 marked a watershed moment in enforcement. Notable increases include:
- ELD user manual violations: +834.3%
- State/local speeding: +866.6%
- Operating out-of-service vehicles with passengers: +317.5%
- Overall Hours of Service violations: +21.1%
- Insurance/Authority violations: +162.0%
Meanwhile, traditional violations declined:
- General safety rules: -20.4%
- Maintenance records: -39.0%
- Driver Qualification: -16.6%
This shift coincided with several regulatory changes. FMCSA increased civil penalties effective December 28, 2023. The 2024 out-of-service criteria, implemented April 1, 2024, included 11 updates to enforcement standards. The 2024 CVSA Roadcheck showed a 23.2% vehicle out-of-service rate, up from 19% in 2023.
Long-Term Trends and Patterns
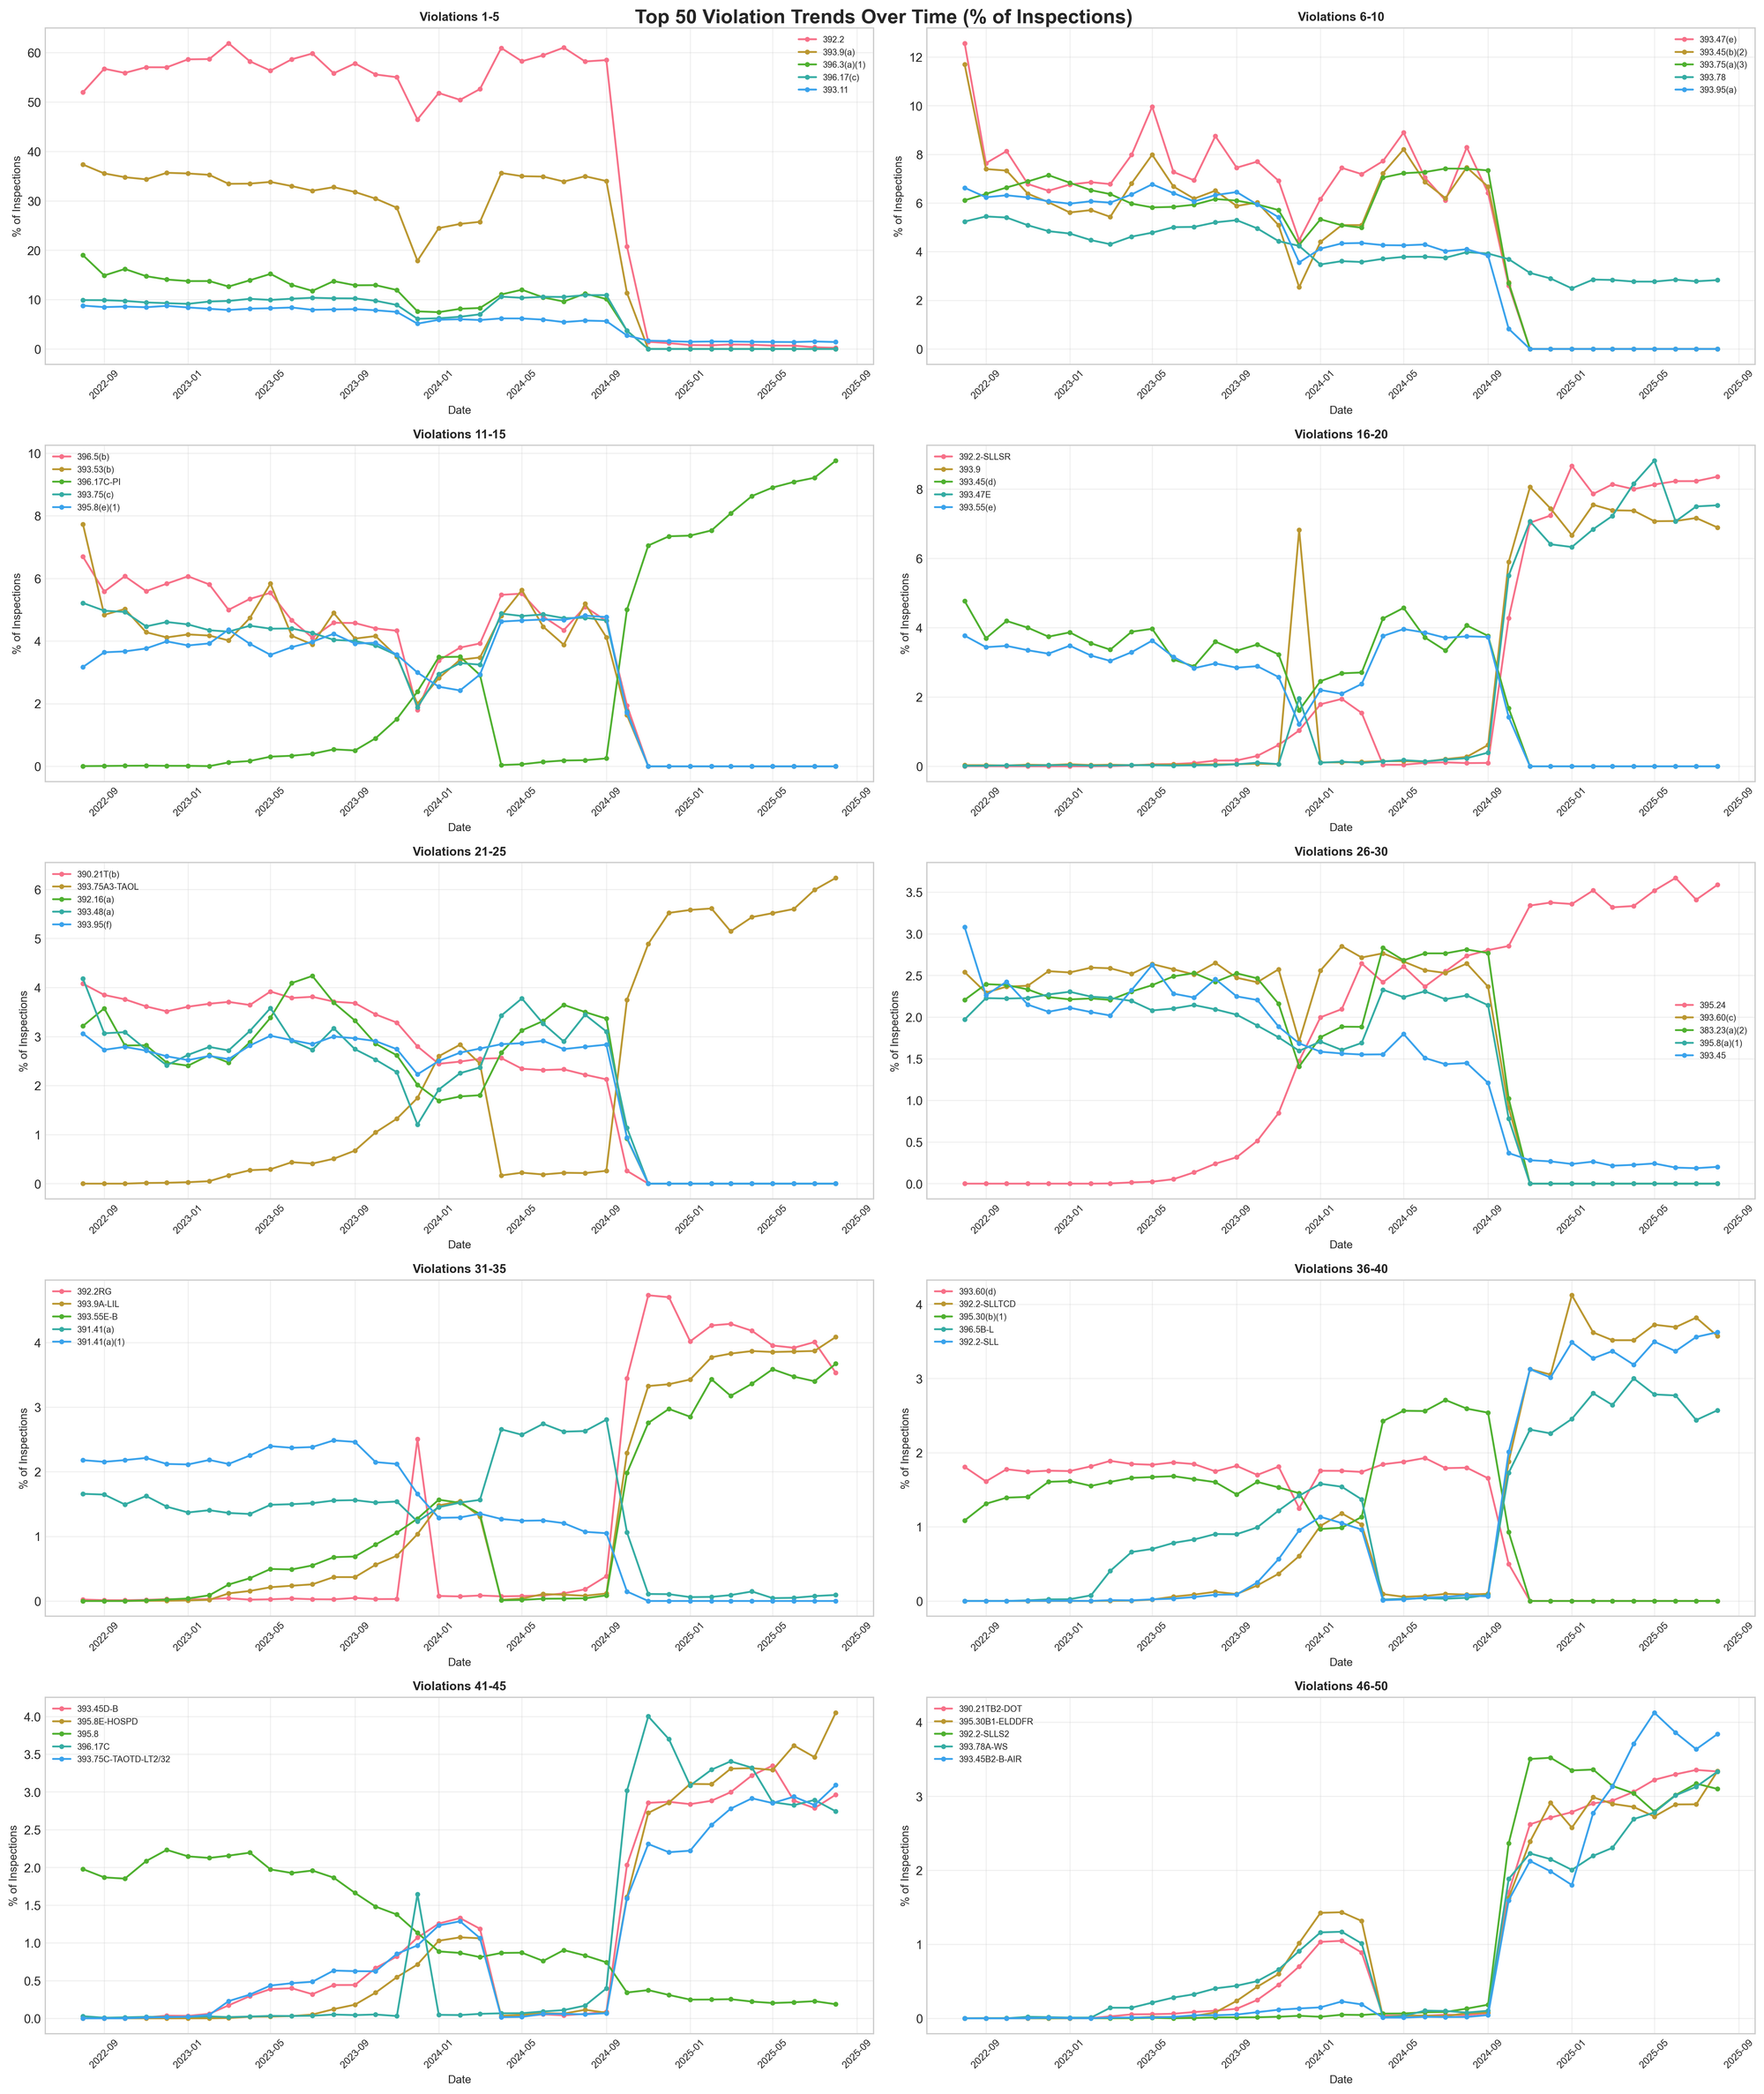
The multi-year view reveals how quickly enforcement priorities can shift. Violations that barely registered in 2022 became major enforcement categories by 2024. Conversely, violations that dominated early in the period have nearly disappeared from inspections.
This volatility suggests that static compliance strategies may be insufficient. Carriers need dynamic approaches that can adapt to rapidly changing enforcement landscapes.
What This Means for the Industry
The data points to several key implications:
- State enforcement is ascendant. Federal standards remain important, but state and local enforcement increasingly drives violation patterns. Carriers must understand and prepare for state-specific requirements and enforcement priorities.
- Technology changes everything. Automated enforcement systems, electronic logging devices, and electronic inspection capabilities are reshaping what gets detected and cited. Manual processes that once went unnoticed may now trigger automatic violations.
- Geography determines risk. A carrier's compliance risk now depends heavily on where they operate. Routes through Texas, California, and Alabama require different preparation than those through other states.
- Timing matters. Seasonal enforcement patterns create windows of higher and lower risk. Smart carriers will adjust their compliance focus based on these predictable cycles.
- Fleet size influences enforcement. Different fleet segments face different violation patterns, suggesting either targeted enforcement or varying compliance capabilities.
Looking Ahead
Several pending changes will likely accelerate these trends. Speed limiter requirements for trucks over 26,000 pounds remain under consideration. Drug and alcohol clearinghouse changes took effect November 18, 2024. States continue to implement new enforcement technologies and strategies.
The enforcement environment has fundamentally changed. What worked for compliance in 2022 may be insufficient in 2024 and beyond. The data suggests we're witnessing not temporary fluctuations but a structural transformation in how commercial vehicle safety is enforced.
For carriers, adaptation is no longer optional. Understanding these patterns—geographic, seasonal, and operational—becomes essential for maintaining compliance in an increasingly complex regulatory environment. The question isn't whether enforcement will continue to evolve, but how quickly carriers can adapt to keep pace with these changes.
Key Takeaways
- State and local enforcement now represents a major compliance risk, with some violations increasing by orders of magnitude
- Geographic location significantly influences violation risk, with some states showing 3-5x the national average for specific violations
- Seasonal patterns create predictable enforcement cycles carriers can anticipate
- Fleet size correlates with specific violation types and patterns
- Traditional federal violations are declining while state-specific and technology-enabled violations surge
- The pace of change is accelerating, requiring dynamic rather than static compliance strategies
The transportation industry faces a new enforcement reality. Success requires understanding not just what the rules are, but where, when, and how they're being enforced.