English Proficiency Violations Surged Months Before Fatal Florida Accident
Analysis of 22,260 Federal Motor Carrier Safety Administration English proficiency violation records reveals a dramatic enforcement surge that began in January 2025—months before the high-profile August 14th Florida accident that killed three family members.

Analysis of 49 CFR Part 391.11B2 violation data covering 22,260 enforcement records
Data Overview
This analysis examines Federal Motor Carrier Safety Administration (FMCSA) enforcement data for 49 CFR Part 391.11B2 violations, which require commercial drivers to demonstrate sufficient English proficiency to communicate with the general public and understand highway signs. The dataset contains 22,260 violation records spanning from 2022 through 2025.
Violation Code Breakdown
The data encompasses five specific violation codes with the following distribution:
- 391.11B2-Q: 11,281 violations (50.7%)
- 391.11B2-Z: 8,427 violations (37.9%)
- 391.11B2: 2,098 violations (9.4%)
- 391.11B2-S: 386 violations (1.7%)
- 391.11B2S: 68 violations (0.3%)
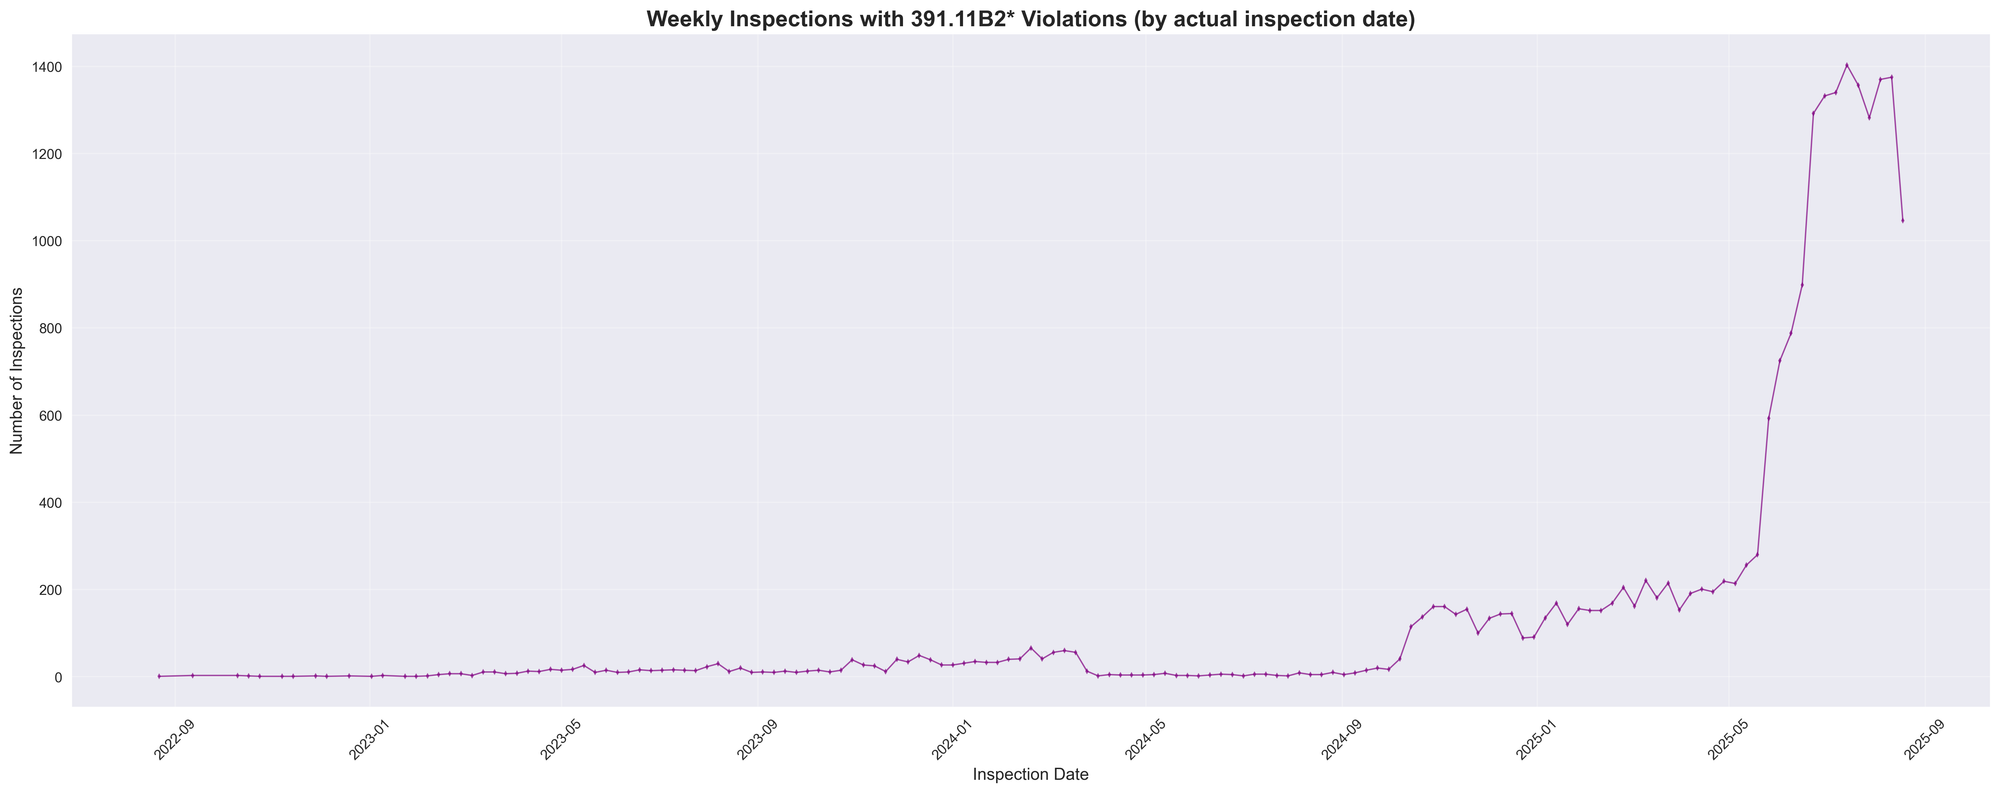
Temporal Patterns and Recent Context
The violation data shows a dramatic increase in enforcement activity beginning in early 2025, well before the August 14, 2025 fatal accident in Fort Pierce, Florida, where a semi-truck driver, who was later found to be an illegal immigrant, made an illegal U-turn on Florida's Turnpike, killing three family members. The tragic Florida incident brought national attention to English proficiency issues in commercial transportation, but the data reveals this was already a growing enforcement trend.
Timeline Analysis
2022-2024: Weekly violation counts remained relatively stable at under 200 per week across most carrier types.
January 20, 2025: The Trump administration takes office, immediately declaring a national emergency at the southern border and implementing comprehensive immigration enforcement measures.
Early 2025: Weekly violation counts begin climbing dramatically, reaching over 1,000 per week by mid-2025.
Spring-Summer 2025: Violation rates continue escalating, reaching peaks of over 1,300 violations per week.
August 14, 2025: Fatal Florida accident occurs after violation trends had already established their upward trajectory.
The data indicates the enforcement surge preceded the high-profile Florida incident by several months, coinciding instead with the new administration's immigration enforcement priorities.
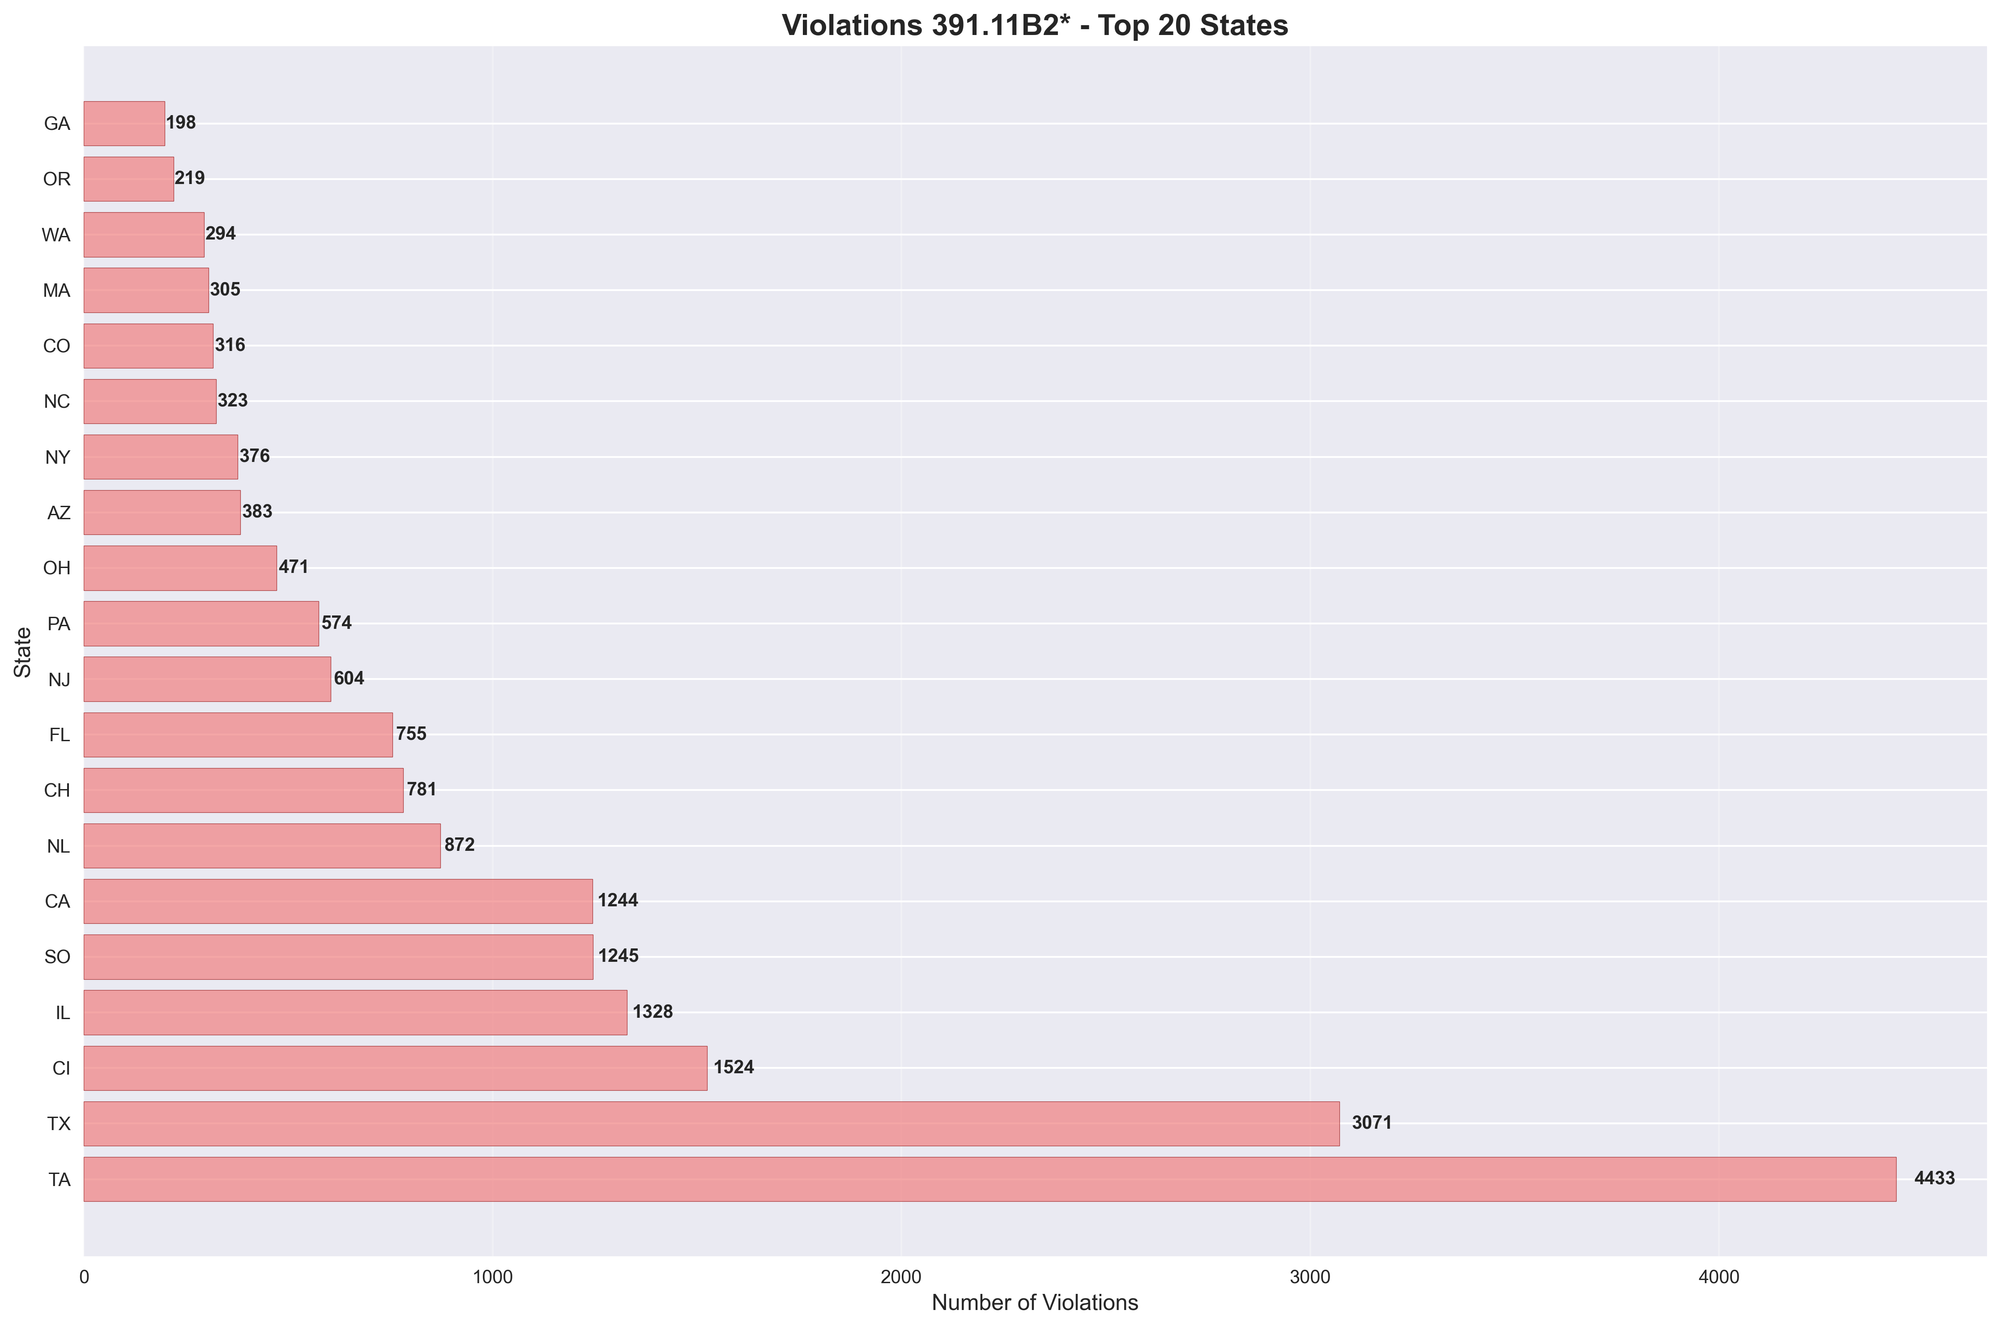
Geographic Distribution
Based on the violation data, certain states show significantly higher enforcement activity:
Highest Violation States:
- Texas: 4,433 violations (19.9% of national total)
- Connecticut: 1,524 violations (6.8%)
- Illinois: 1,328 violations (6.0%)
- South Carolina: 1,245 violations (5.6%)
- California: 1,244 violations (5.6%)
Texas represents the single largest concentration of violations, with nearly one in five violations occurring in the state.
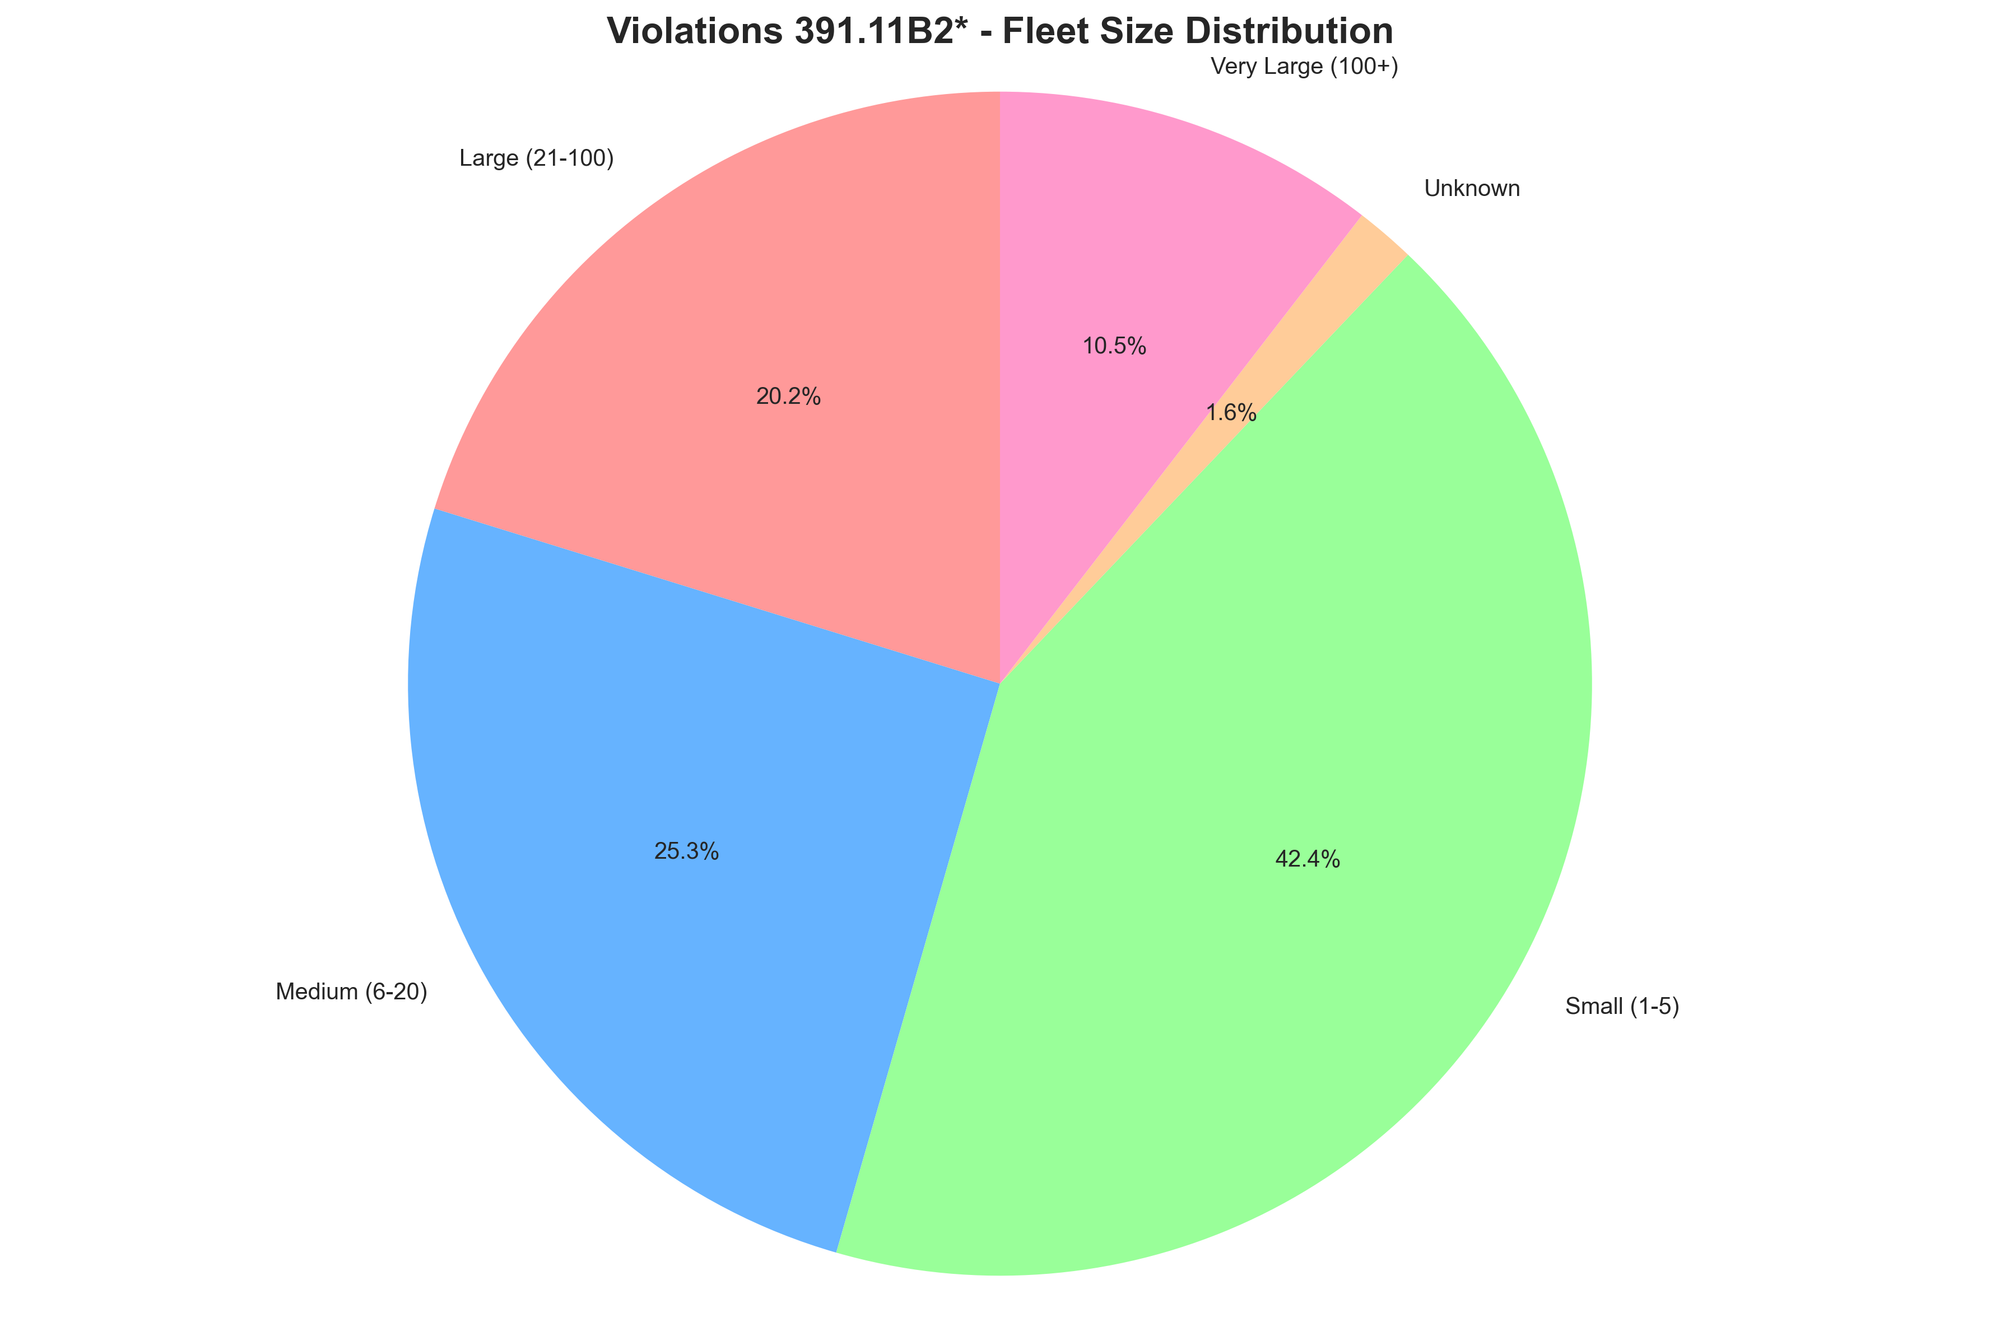
Fleet Size Analysis
Violations by fleet size category:
- Small (1-5 vehicles): 9,429 violations (42.4%)
- Medium (6-20 vehicles): 5,636 violations (25.3%)
- Large (21-100 vehicles): 4,501 violations (20.2%)
- Very Large (100+ vehicles): 2,331 violations (10.5%)
- Unknown: 363 violations (1.6%)
Small fleets represent the highest percentage of violations despite comprising a smaller portion of overall commercial vehicle operations.
Carrier Type Distribution
Violations by fleet type:
- Authorized for-hire: 20,074 violations (90.2%)
- Private property: 1,080 violations (4.8%)
- Unspecified: 1,017 violations (4.6%)
- Exempt for-hire: 73 violations (0.3%)
- Private passenger business: 7 violations (<0.1%)
- Other: 6 violations (<0.1%)
- Private passenger nonbusiness: 3 violations (<0.1%)
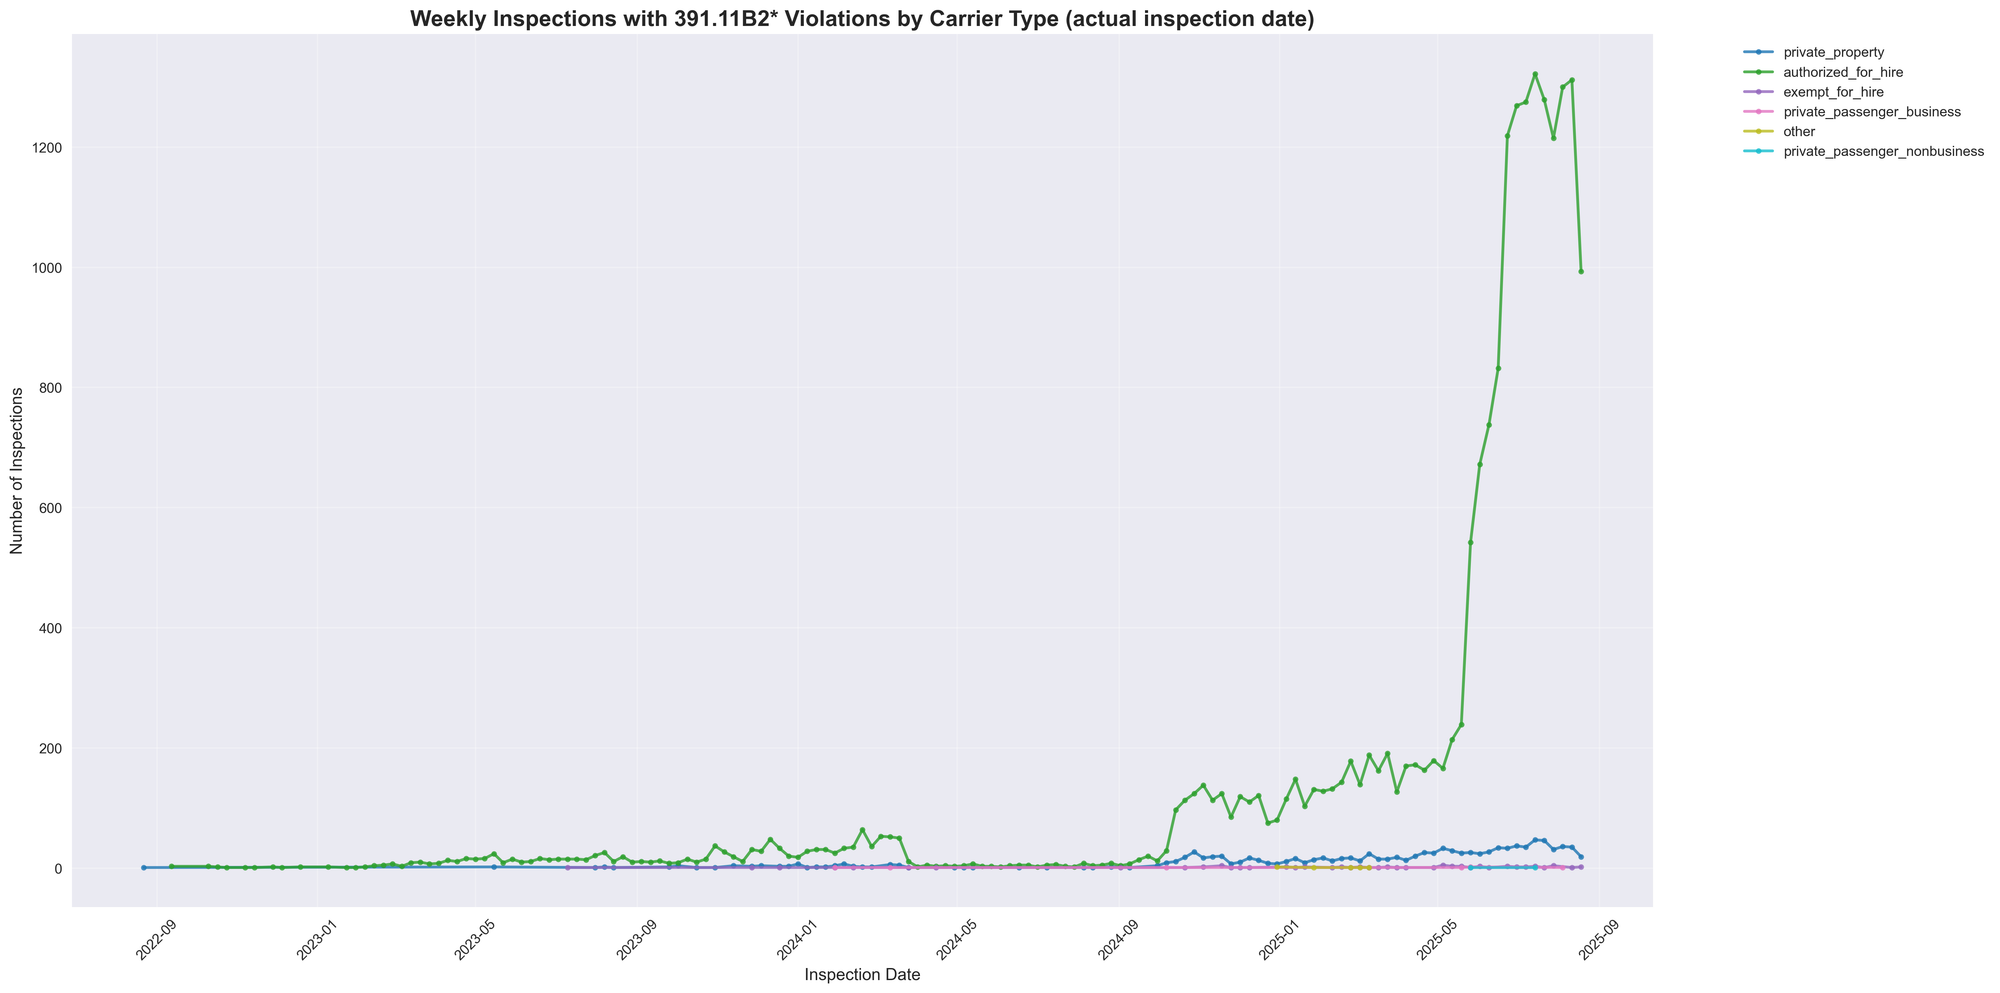
Carrier Type Trends Over Time
Weekly inspection data reveals distinct patterns by carrier type, with the overall enforcement surge driven primarily by authorized for-hire carriers, which represent 90.2% of all violations (20,074 violations). The temporal charts show dramatic increases beginning in early 2025, with weekly violations climbing from stable levels under 200 per week to peaks over 1,300 per week by summer 2025.
While authorized for-hire carriers account for the vast majority of violations, the data shows relatively small numbers across other carrier categories: private property carriers had 1,080 violations (4.8%), while exempt for-hire carriers—which transport exempt commodities including agricultural products—accounted for only 73 violations (0.3%) of the total. This suggests the enforcement surge was broadly focused across commercial transportation rather than targeting specific commodity types or carrier categories.
Enforcement Outcomes
Out-of-service determinations by violation:
- No out-of-service order: 19,029 violations (85.5%)
- Out-of-service order issued: 3,231 violations (14.5%)
Approximately one in seven violations resulted in immediate removal from service.
Summary Statistics
- Total violations: 22,260
- Date range: 2022 - 2025
- Peak weekly violations: Over 1,300 (2025)
- Geographic concentration: Texas (19.9%), Connecticut (6.8%), Illinois (6.0%)
- Primary carrier type: Authorized for-hire (90.2%)
- Primary fleet size: Small fleets 1-5 vehicles (42.4%)
- Out-of-service rate: 14.5%
Key Findings: The data demonstrates a clear correlation between enhanced immigration enforcement measures beginning in January 2025 and dramatic increases in English proficiency violations. The enforcement surge was well-established months before the August 2025 fatal accident.