Mapping Electric Commercial Vehicle Adoption: A Geographic and Fleet Analysis
We examined the current state of electric commercial vehicle deployment across the United States by leveraging federal inspection data.

Methodology
In this analysis, I examined the current state of electric commercial vehicle deployment across the United States by leveraging federal inspection data. The approach involved identifying 26 distinct VIN prefixes associated with electric trucks and buses from 14 manufacturers, then tracing these vehicles back through inspection records to their operating fleets via DOT numbers. By mapping FIPS codes from inspection locations, I was able to construct a detailed geographic picture of where these vehicles are operating.
Dataset Overview
The analysis captured 10,267 inspection records representing 3,697 unique electric commercial vehicles operated by 1,743 distinct fleets. These vehicles were identified across 52 states and territories and 651 counties, providing a comprehensive view of electric commercial vehicle deployment patterns.
Manufacturer Distribution
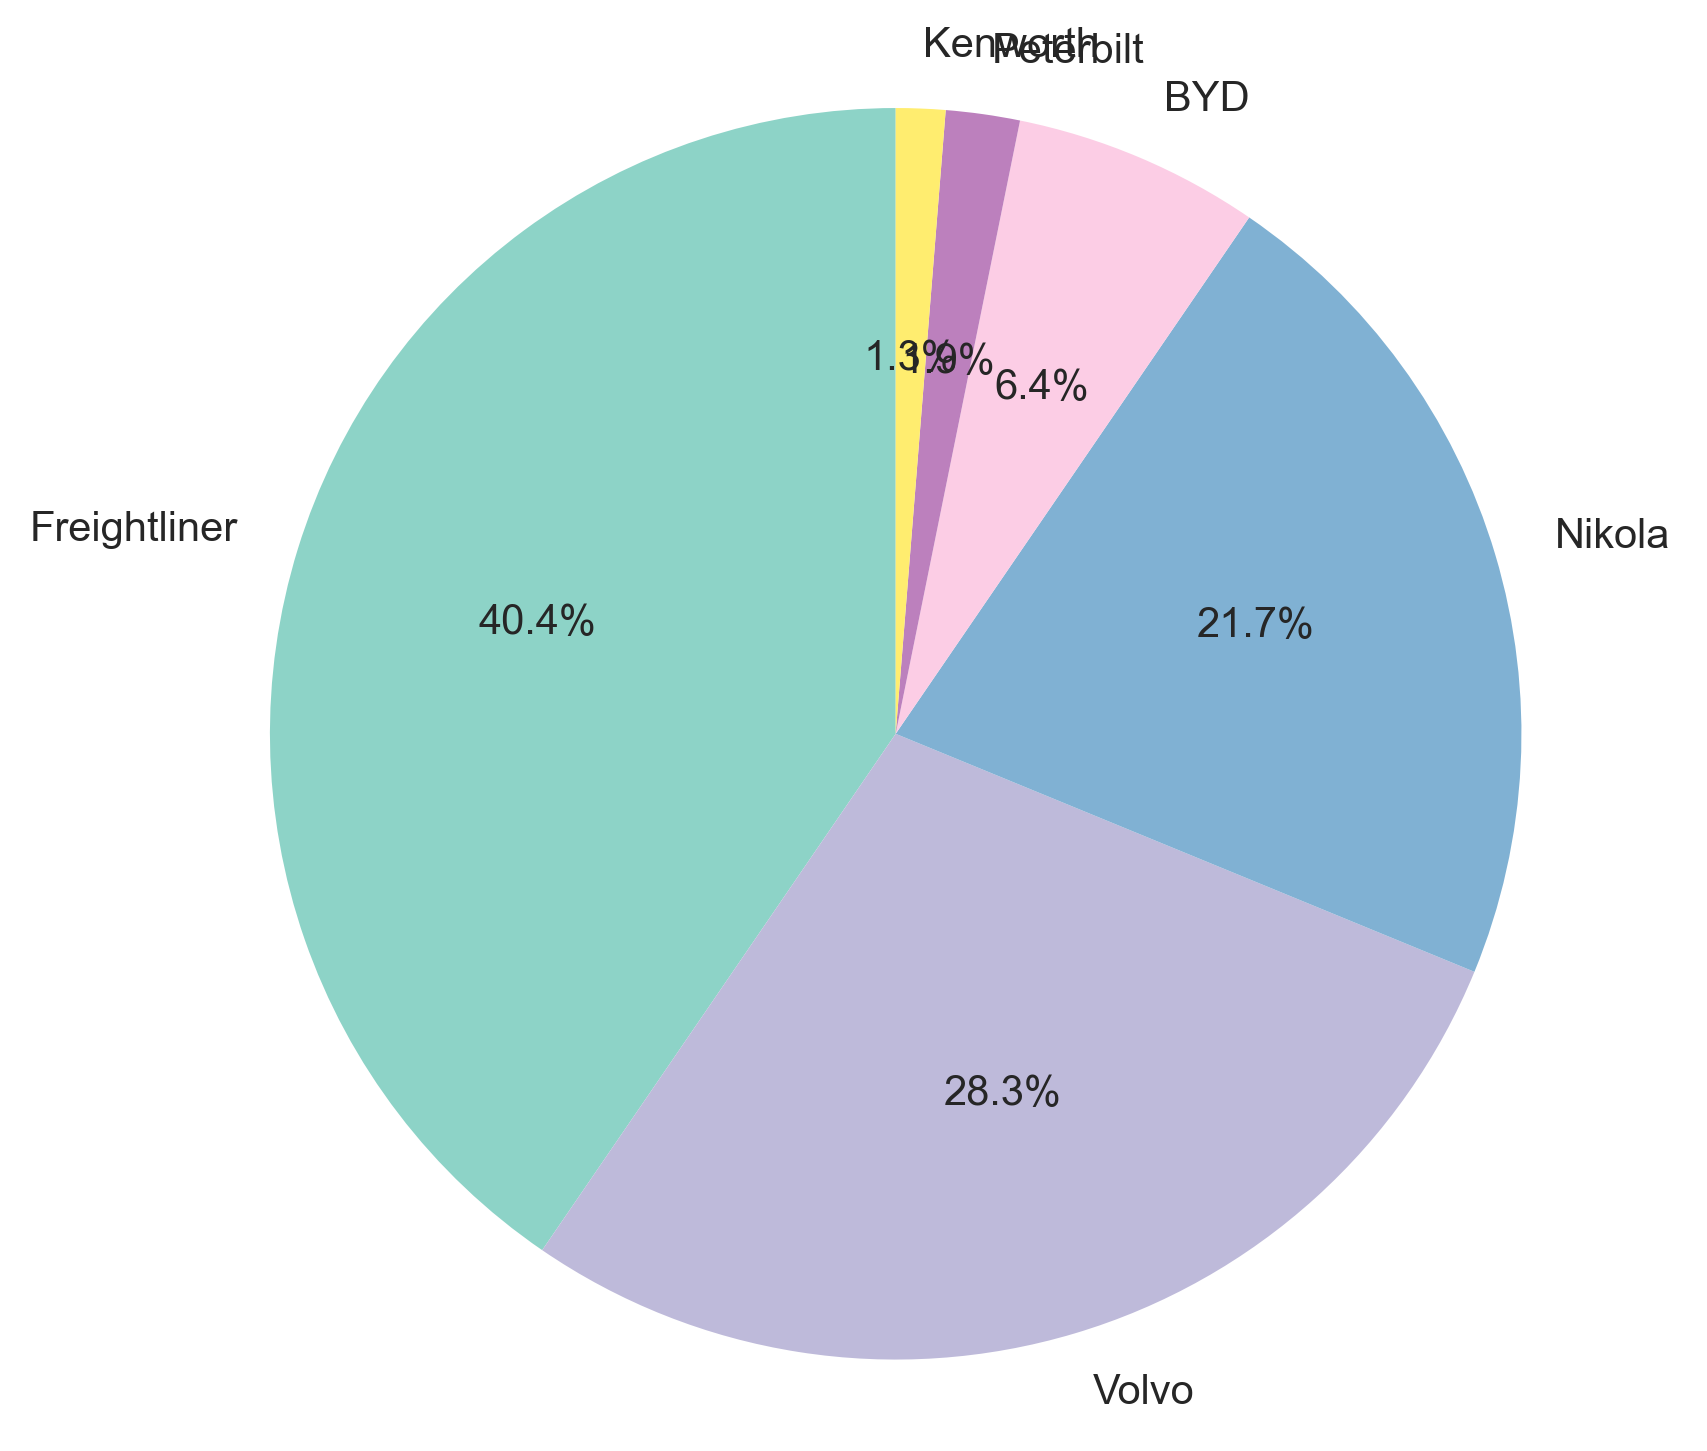
The electric commercial vehicle market shows significant concentration among a few key manufacturers:
- Hino dominates with 6,867 inspections (66.9% of all records)
- Bluebird follows with 2,702 inspections (26.3%)
- Rizon accounts for 167 inspections (1.6%)
- Ford shows 132 inspections across three VIN patterns (1.3%)
- Freightliner registers 127 inspections (1.2%)
The remaining manufacturers—including Volvo, Nikola, GreenPower, ARBOC, BYD, International, Peterbilt, and Kenworth—collectively represent less than 3% of inspection records.
Take away is that most of the electric vehicles associated with inspection records are operated within regional transit systems (either for school or other purposes). When focused solely on class-8 vehicles, the distribution changes a bit.
Geographic Patterns
State-Level Distribution
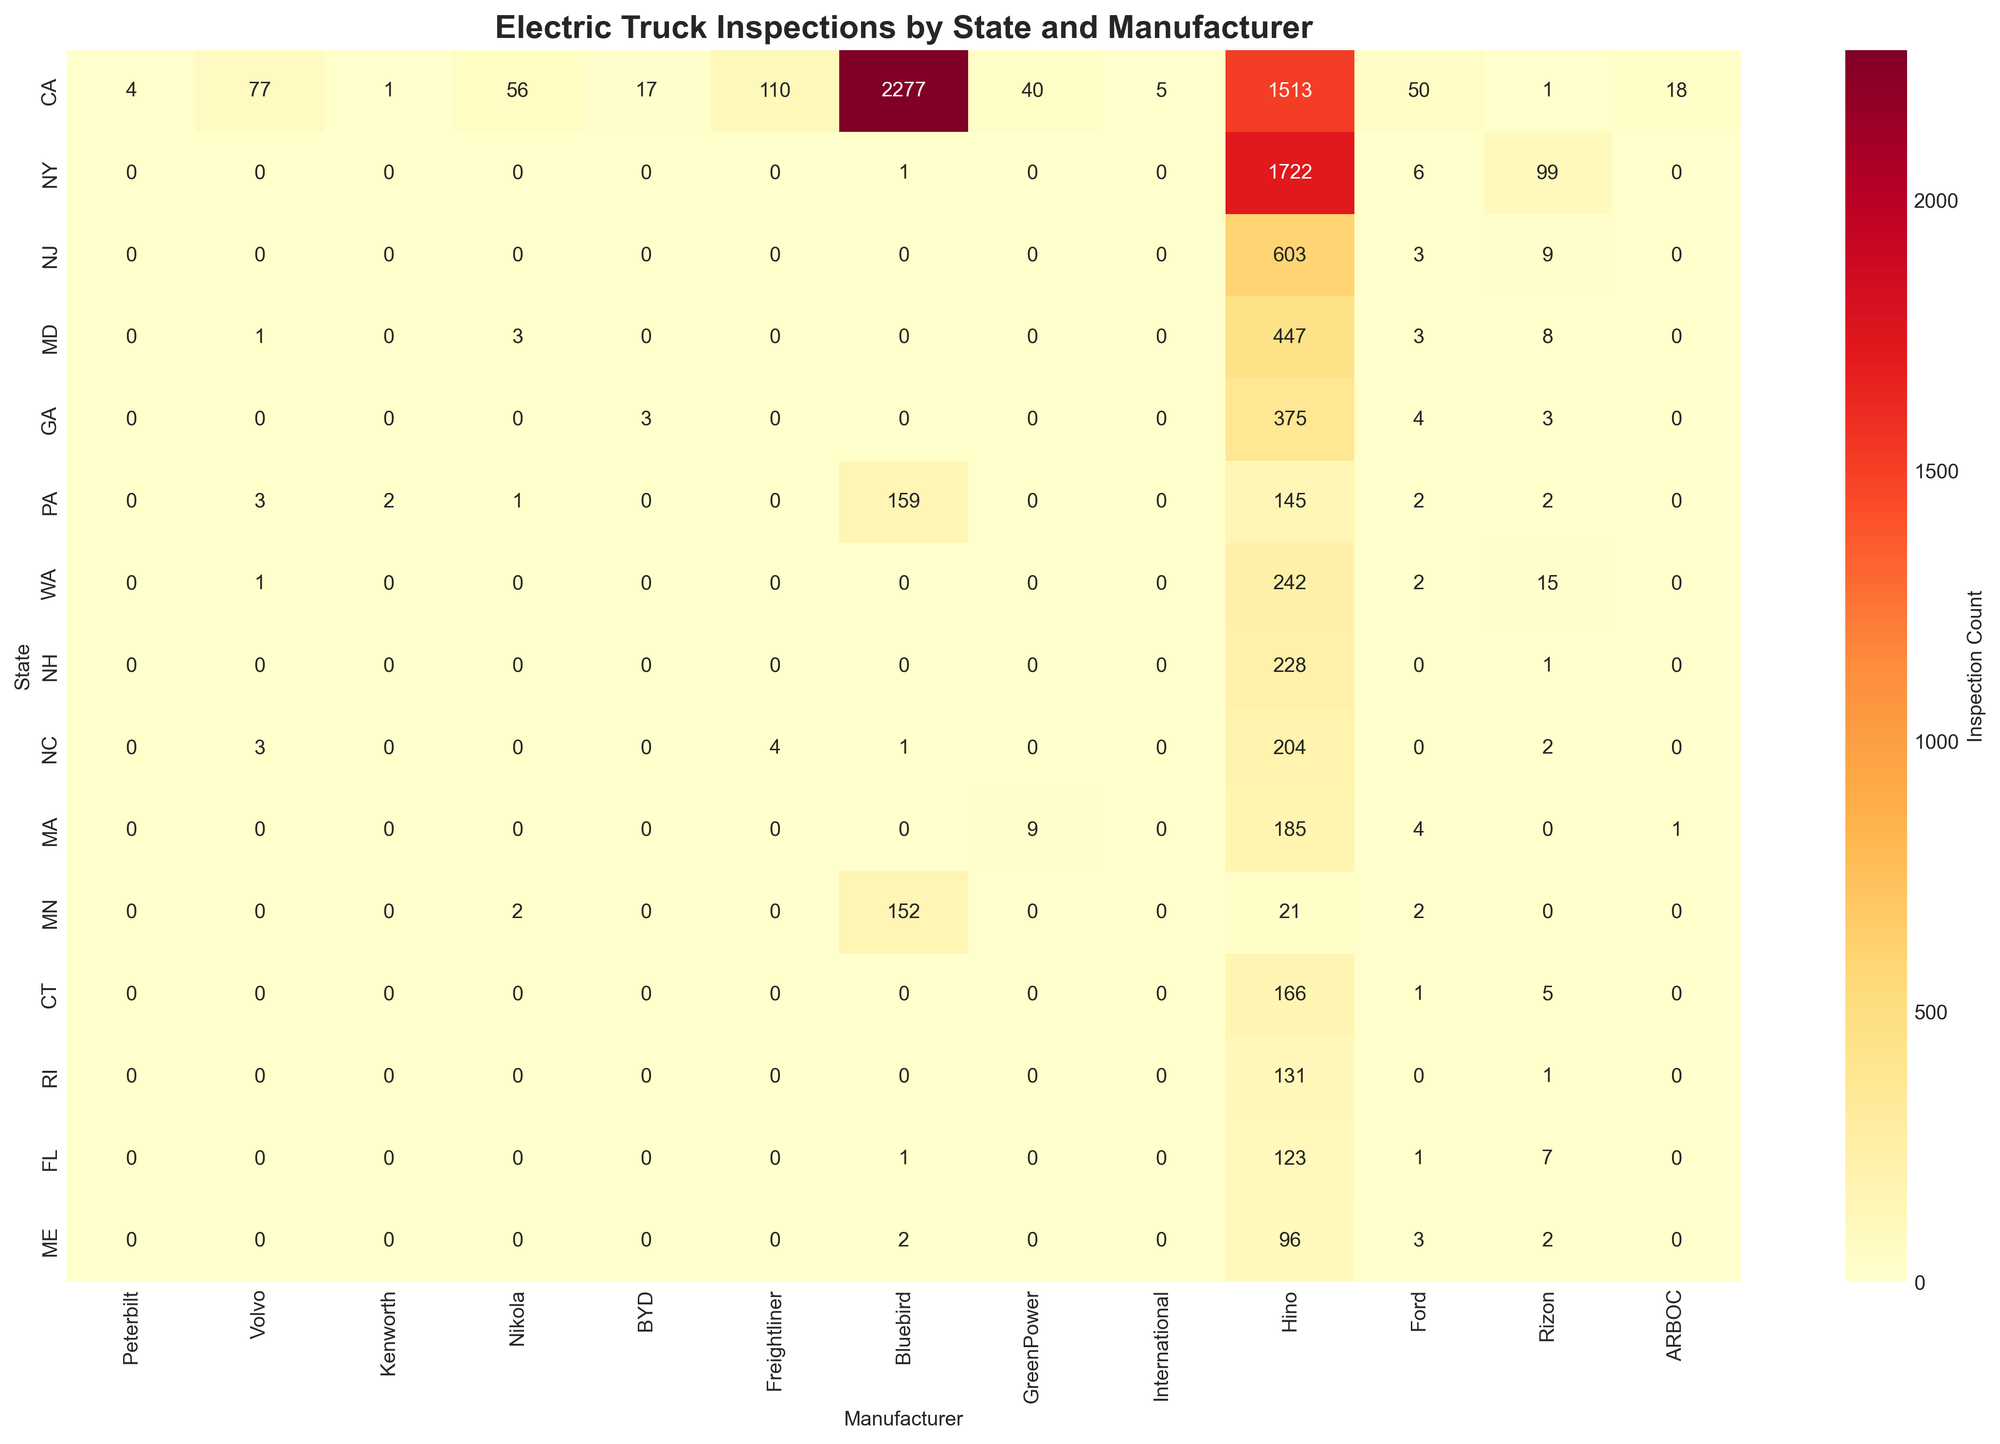
The heatmap reveals strong geographic clustering, with California showing particularly high adoption of Hino and Bluebird vehicles, while New York demonstrates significant Hino deployment. The visualization highlights how different manufacturers have established regional strongholds.
Electric commercial vehicles show strong geographic clustering, with the top 10 states accounting for the majority of activity:
- California: 4,252 inspections
- New York: 1,741 inspections
- New Jersey: 611 inspections
- Maryland: 508 inspections
- Georgia: 385 inspections
- Pennsylvania: 345 inspections
- Washington: 244 inspections
- North Carolina: 238 inspections
- New Hampshire: 237 inspections
- Massachusetts: 235 inspections
California alone accounts for over 40% of all electric commercial vehicle inspections, with New York representing another 17%.
Regional Analysis
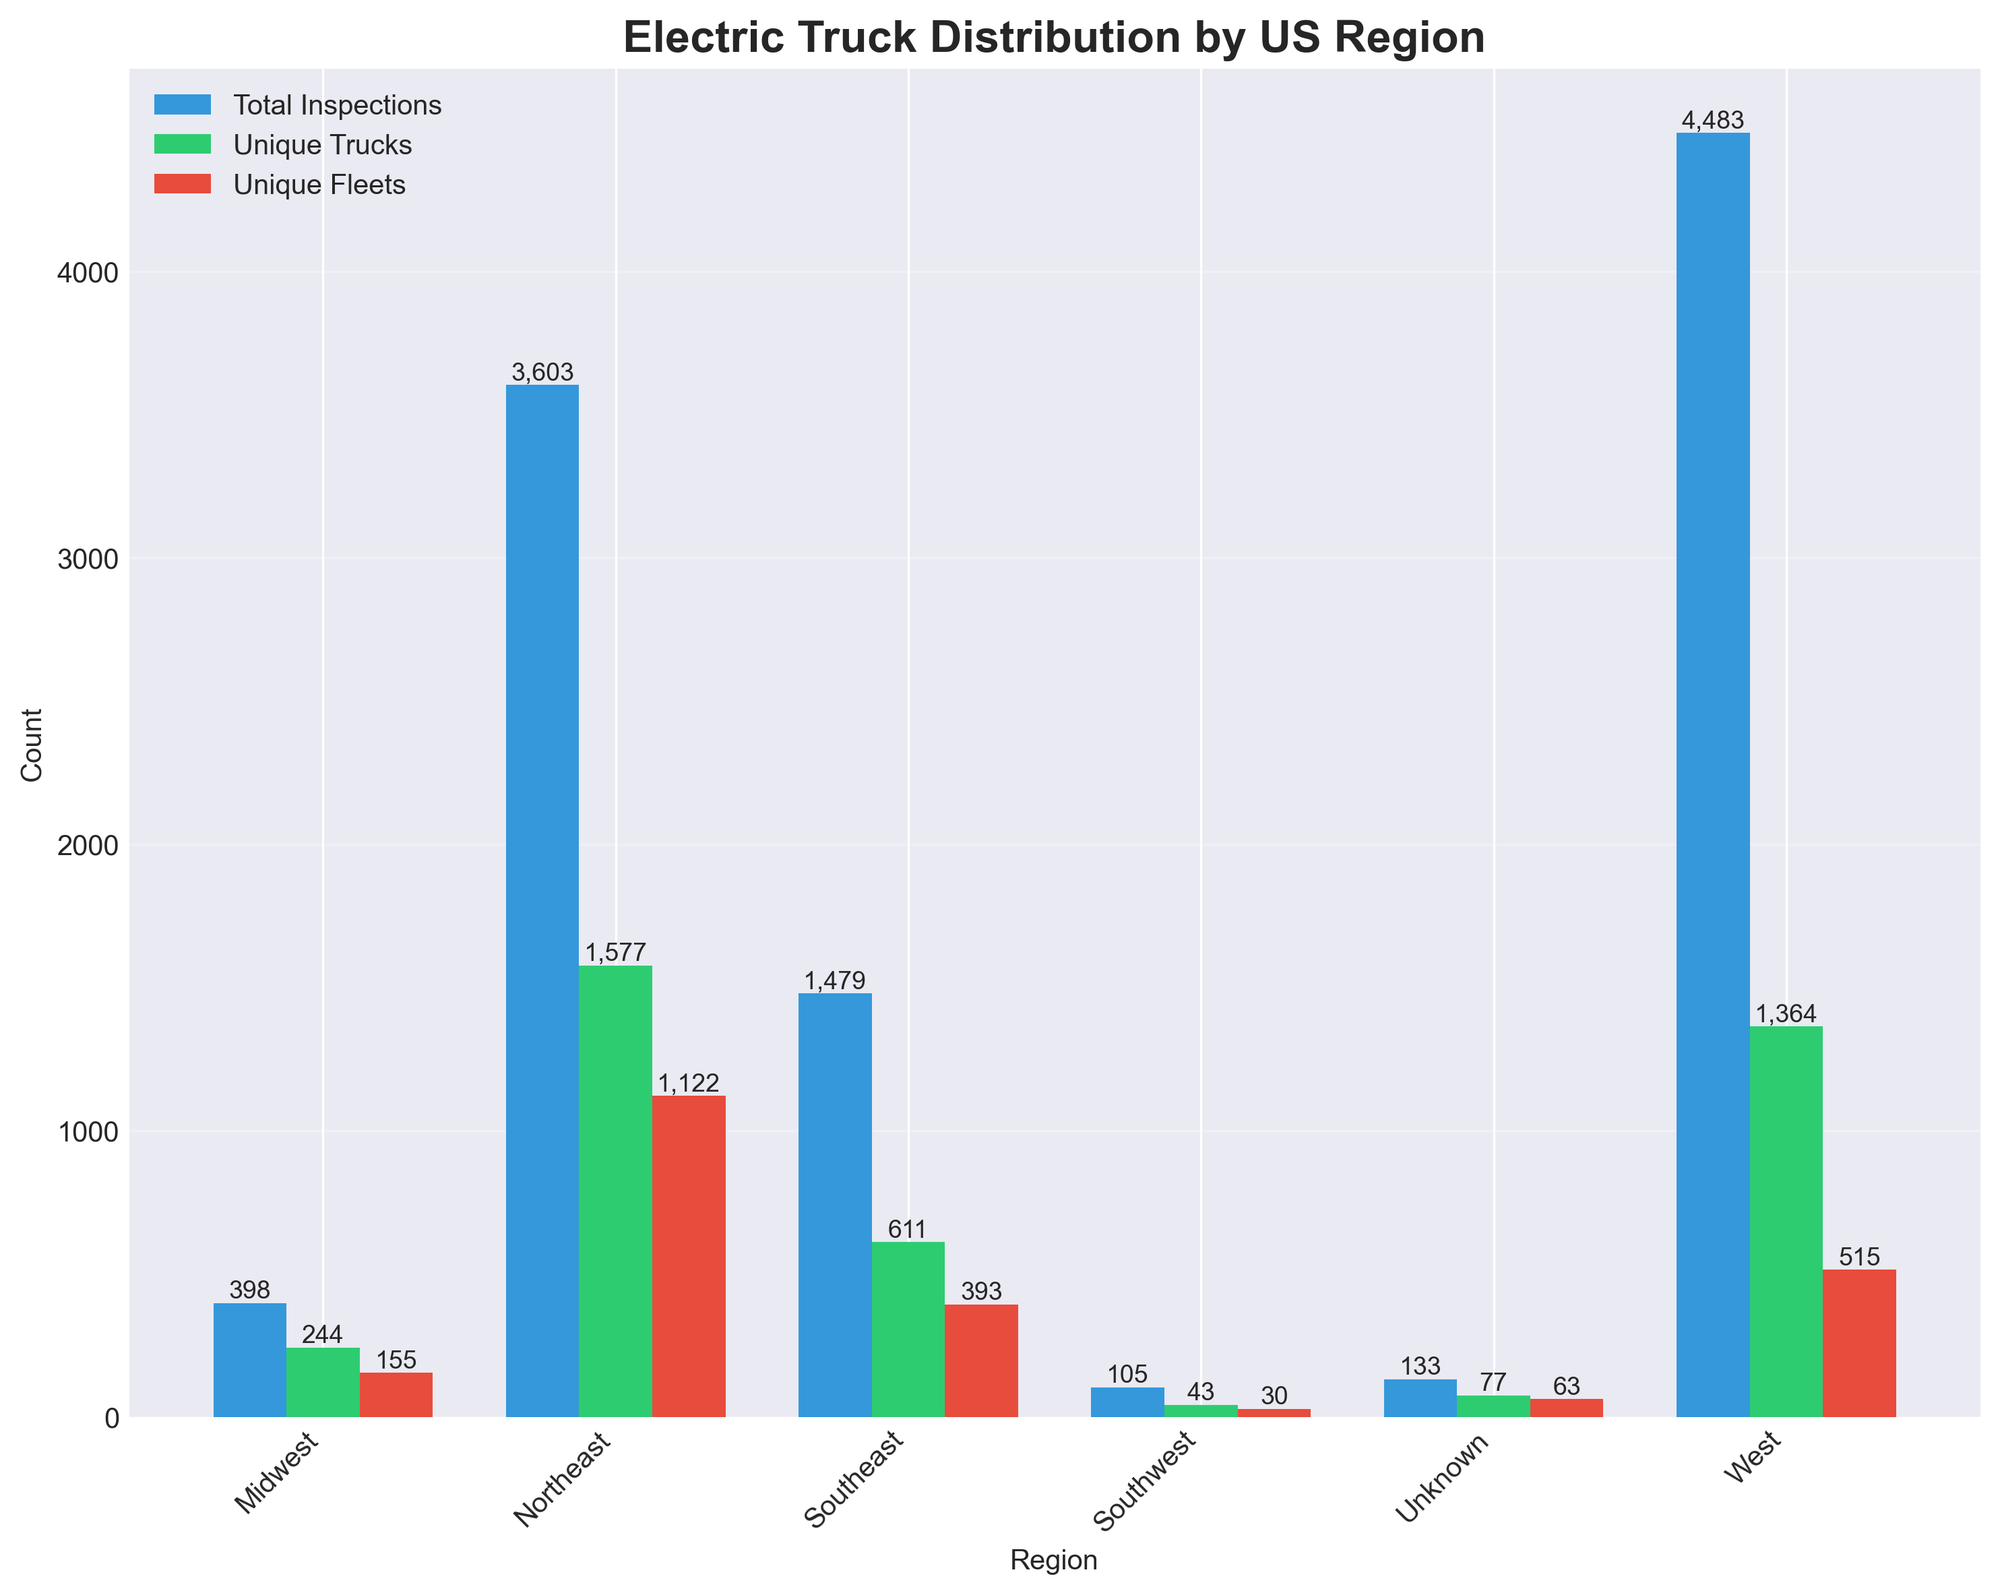
The regional distribution chart reveals that the West leads with 4,549 total inspections, followed by the Northeast with 3,620 inspections. The Southeast, Southwest, and Midwest show significantly lower adoption rates, while activity in regions labeled as "Unknown" remains minimal.
County-Level Concentration
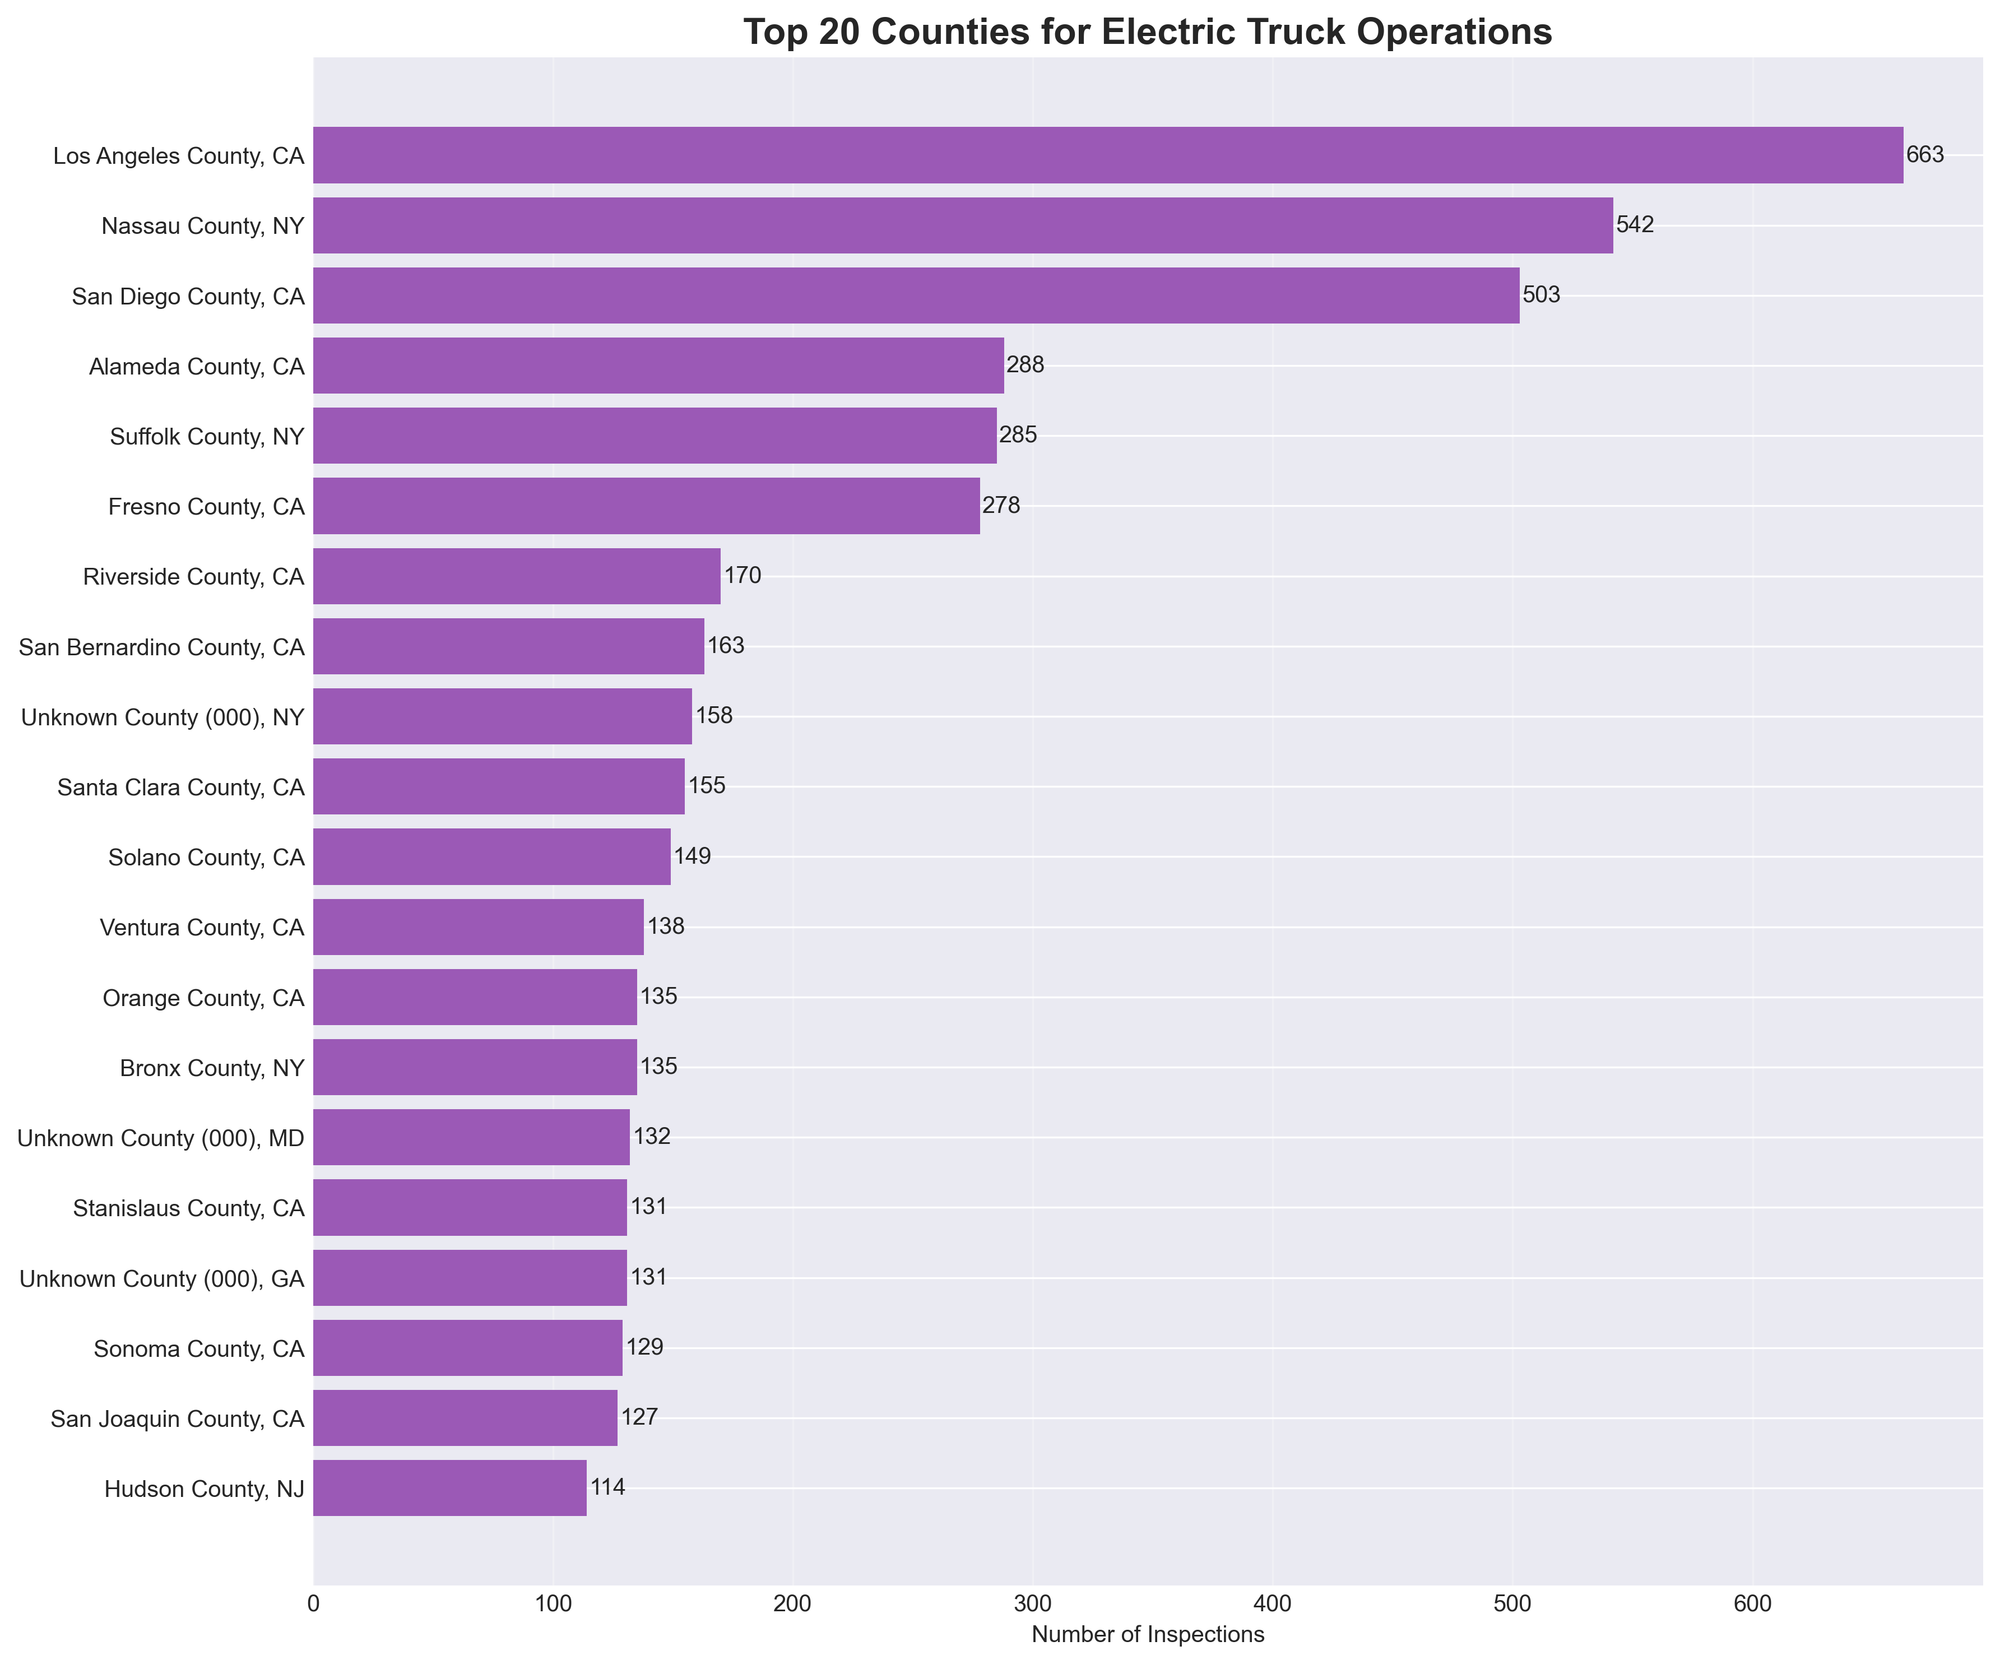
At the county level, urban areas dominate the deployment landscape. Los Angeles County leads dramatically with 728 inspections, followed by Nassau County, NY (561) and San Diego County, CA (444). The visualization shows a clear concentration in California counties, with 11 of the top 20 counties located in the state.
Notably, Fresno County shows high inspection volume (285) concentrated among relatively few fleets (11), suggesting larger-scale deployments, while Nassau County's 561 inspections are distributed across 173 fleets, indicating more dispersed adoption.
Fleet Adoption Profiles
Fleet Size Distribution
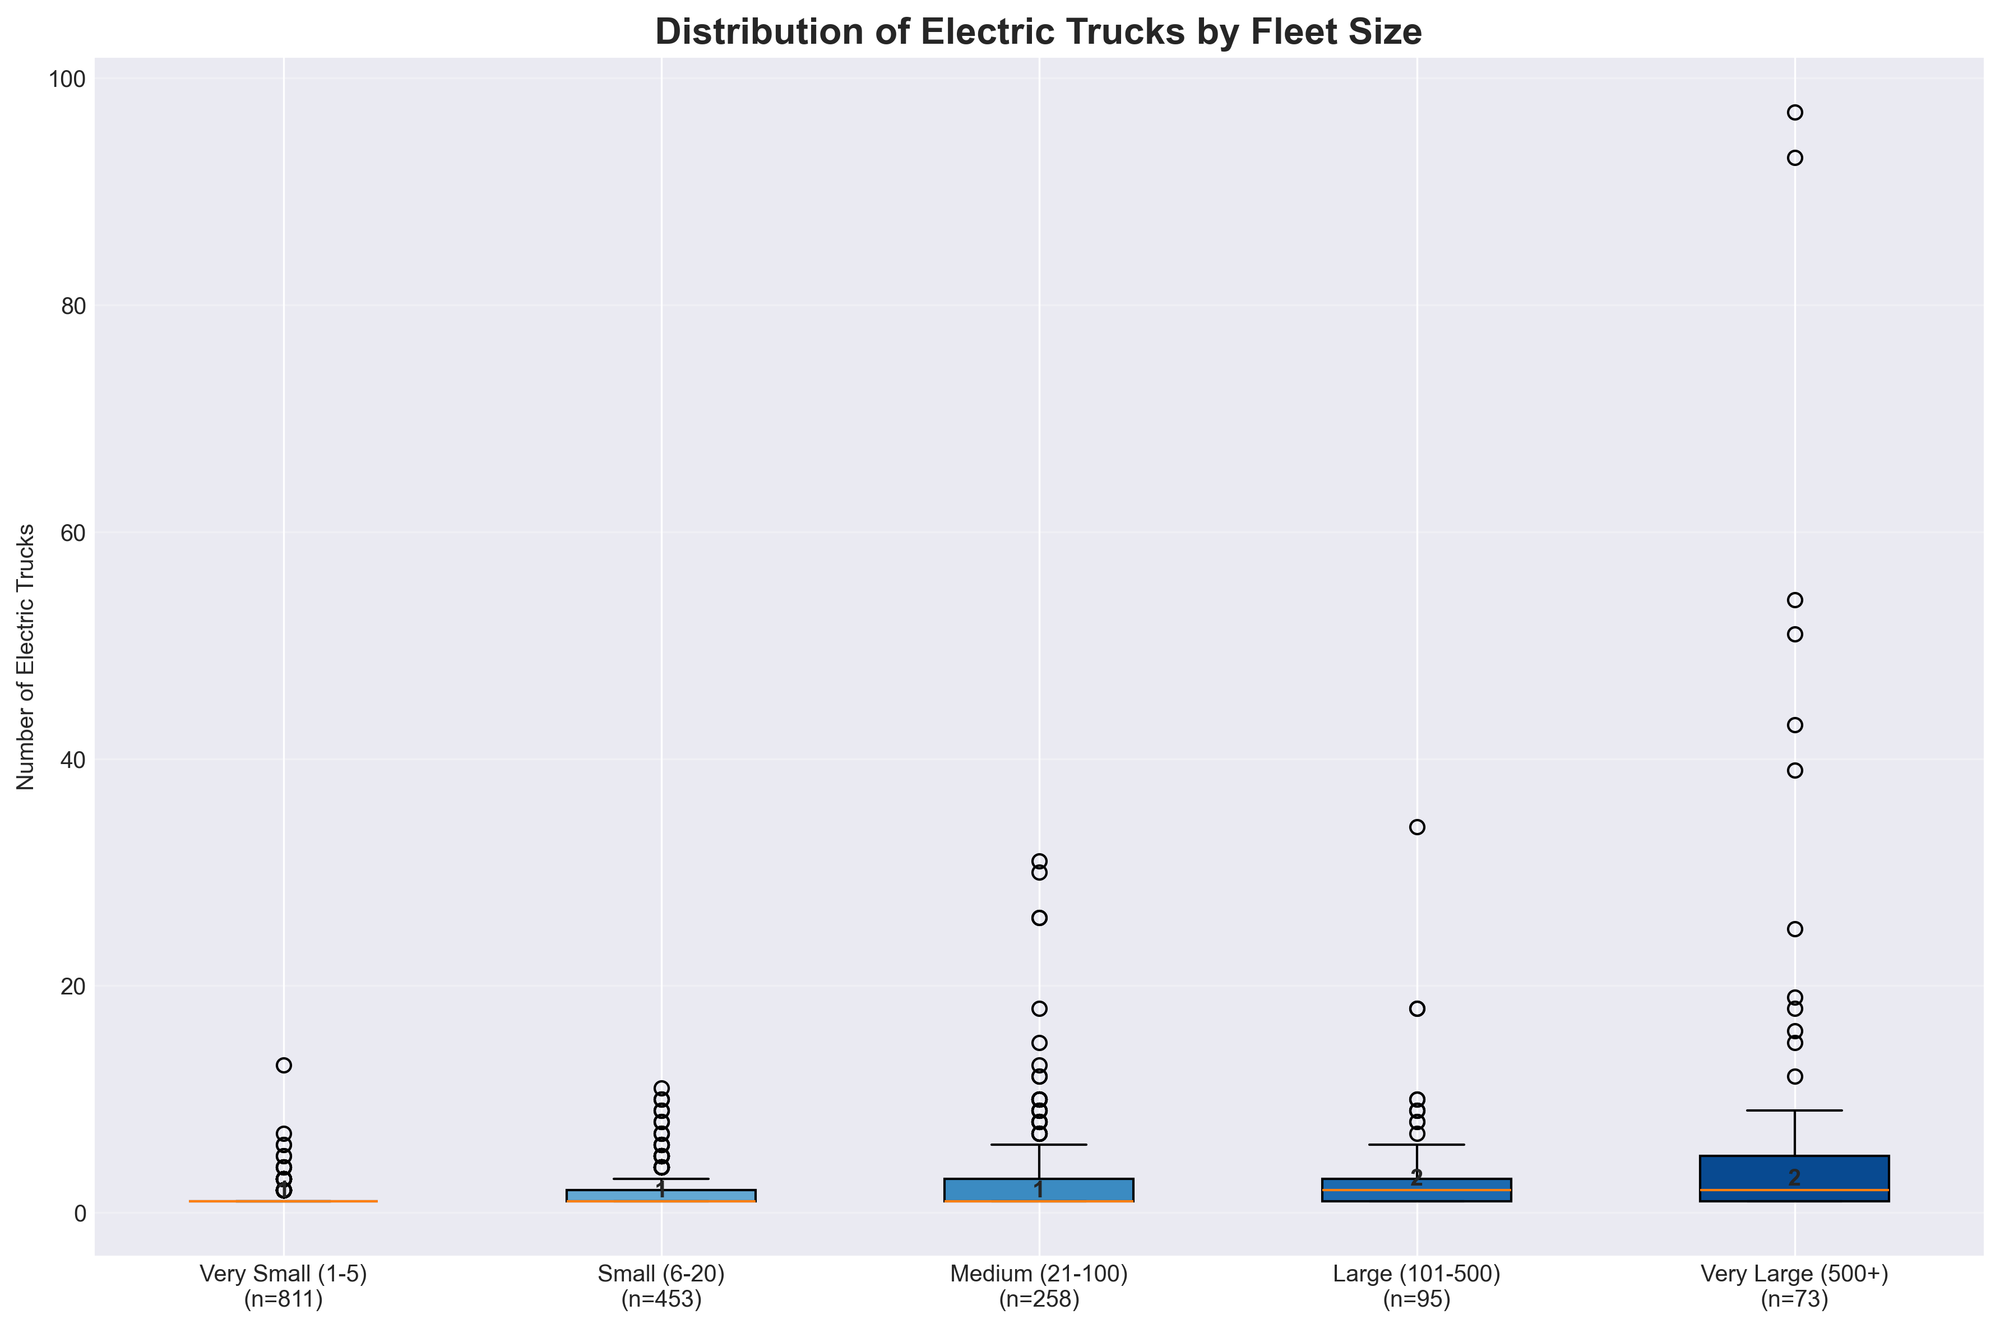
The box plot visualization reveals interesting patterns in electric vehicle adoption across different fleet sizes:
- Very Small fleets (1-5 vehicles): 815 fleets (46.8%), averaging 1.2 electric trucks each
- Small fleets (6-20 vehicles): 456 fleets (26.2%), averaging 1.8 electric trucks
- Medium fleets (21-100 vehicles): 259 fleets (14.9%), averaging 3.1 electric trucks
- Large fleets (101-500 vehicles): 96 fleets (5.5%), averaging 3.3 electric trucks
- Very Large fleets (500+ vehicles): 72 fleets (4.1%), averaging 10.1 electric trucks
The visualization shows that while very large fleets have the highest average number of electric trucks, there's considerable variation within each category, with numerous outliers indicating fleets that have made particularly aggressive electric vehicle investments.
Leading Adopters
The top electric vehicle fleet operators show interesting diversity in fleet types:
- Los Angeles Unified School District: 51 electric trucks (3,4% of their 1,497 power unit fleet)
- Southeastern Freight Lines Inc: 97 trucks (3% of 3,227 power units)
- Staples Contract and Commercial LLC: 93 trucks (9% of 1,034 power units)
- Zum Services Inc: 54 trucks (2.97% of 1,818 power units)
- A Duie Pyle Inc: 39 trucks (1.96% of 1,985 power units)
- Schneider National Carriers: 43 trucks (.43% of 9,959 power units)
School districts feature prominently among adopters, with several showing high electric vehicle percentages relative to their total fleet size. For instance, Modesto City School District operates 30 electric trucks, representing 42.3% of their 71-vehicle fleet, while La Tortilla Factory Inc has achieved 45% electrification with 27 electric trucks out of 60 total power units.
Temporal Patterns
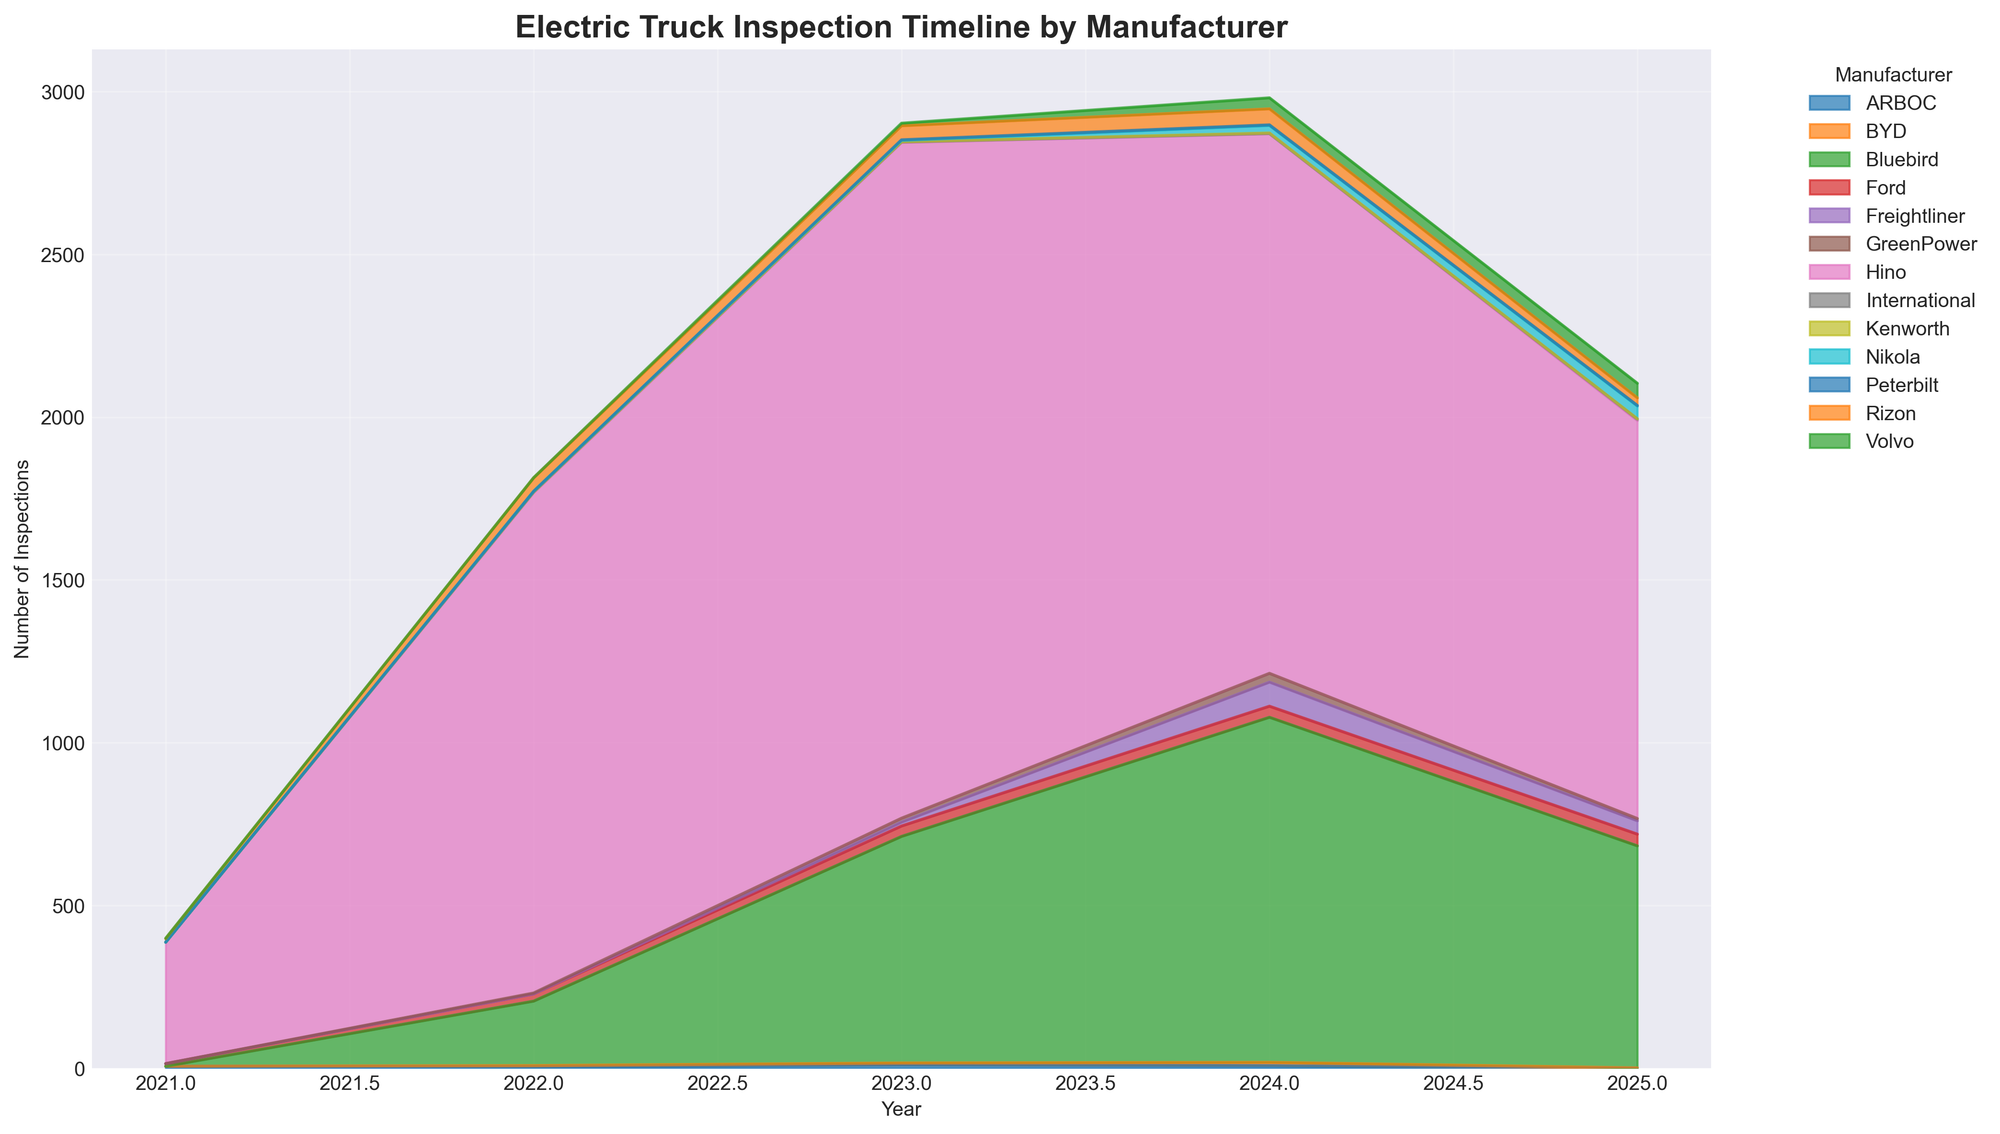
The timeline visualization shows the evolution of electric truck inspections from 2021 through 2025. Key observations include:
- Rapid growth from 2021 to 2023, with inspections peaking around 2,850 vehicles
- A noticeable decline beginning in 2024, with 2025 showing approximately 2,200 inspections
- Hino (shown in pink) maintains dominant market share throughout the period
- Bluebird (green) shows steady growth, becoming more prominent over time
- Newer entrants like Nikola, Volvo, and Rizon appear as thin bands, indicating their emerging presence
The data indicates 1,360 unique electric trucks were active in 2025 inspection records, though year-over-year comparisons should be interpreted cautiously given the partial year data.
Key Observations
This analysis reveals several notable patterns in electric commercial vehicle deployment:
- Geographic concentration: Over half of all electric commercial vehicle activity occurs in just two states (California and New York), with California counties occupying 11 of the top 20 positions for inspection volume.
- Manufacturer concentration: Two manufacturers (Hino and Bluebird) account for over 93% of inspection records, suggesting a highly consolidated supplier landscape.
- Fleet diversity: Electric vehicle adoption spans from single-vehicle operators to fleets with thousands of vehicles, though very large fleets show the highest average adoption rates (10.1 electric trucks per fleet).
- School district prominence: Educational institutions represent a significant portion of high-volume electric vehicle adopters, with some districts achieving electrification rates exceeding 40% of their total fleet.
- Urban clustering: County-level data shows strong concentration in major metropolitan areas, particularly in California's urban centers and the New York metropolitan region.
- Regional disparities: The West and Northeast regions account for over 80% of all electric commercial vehicle inspections, while adoption in the Southeast, Southwest, and Midwest remains comparatively limited.
Data Availability
The complete dataset includes state-level summaries, county distributions, detailed fleet profiles, manufacturer breakdowns, and temporal trends. This granular data enables further analysis of adoption patterns, geographic clustering, and fleet deployment strategies. All visualizations and supporting CSV files are available for additional exploration of specific markets, manufacturers, or fleet segments.
Caveats
This analysis is limited by the breadth of vin patterns found that are associated with electric vehicles. As new models are introduced to market, their vin numbers are not always readily available which limits our ability to identify them in inspection data.
This analysis is based on federal inspection data accessed through VIN pattern matching and DOT number lookup. The inspection counts serve as a proxy for vehicle activity and deployment patterns but may not represent the complete universe of electric commercial vehicles in operation.
