Measuring What Matters: A Data-Driven Look at Driver Out-of-Service Rates
A comprehensive analysis reveals that carrier age and fleet size are the dominant predictors of driver safety performance, with new carriers showing 4x higher OOS rates than veterans and small fleets recording 37x higher rates than mega carriers.

Key Takeaways
- Most carriers are actually compliant - Every fleet size and age category shows 0% median OOS rates, meaning the majority of carriers maintain clean driver safety records
- Age matters more than expected - New carriers (<1 year) have 4x higher driver OOS rates than veteran carriers (20+ years), revealing a significant compliance learning curve
- Size matters even more - Small fleets (1-5 drivers) show 37x higher OOS rates than mega fleets (500+ drivers), indicating operational scale provides substantial safety advantages
- Safety issues are highly concentrated - High industry averages are driven by a minority of problematic carriers rather than systemic compliance failures across the trucking industry
- Data quality transforms analysis - Removing just the most extreme outliers (48% of carriers) revealed realistic patterns hidden beneath statistical noise
When analyzing driver Out-of-Service (OOS) performance in commercial trucking, measurement methodology matters enormously. A comprehensive analysis of federal inspection data reveals that how you calculate rates, handle outliers, and account for carrier characteristics can paint dramatically different pictures of the same underlying safety landscape. The results challenge conventional assumptions about industry-wide compliance and reveal surprising patterns in how carrier age and size influence safety outcomes.
Understanding the Data: Sources and Limitations
This analysis combines federal commercial vehicle inspection records with carrier census information, examining driver OOS patterns across 5.5 million inspections and 250,252 OOS events. The inspection data captures actual roadside enforcement activity, while driver counts derive from carrier-reported census information filed with federal regulators.
Several factors shape the interpretation of these findings:
Census Data Reliability: Driver counts rely on carrier self-reporting, which may be inaccurate especially for smaller carriers with fluctuating workforces. The extreme outliers removed likely represent cases where reported driver counts don't match operational reality.
Inspection Selection Bias: Roadside inspections aren't randomly distributed. Enforcement priorities, geographic patterns, and carrier history influence which drivers face inspection, potentially skewing the analysis.
Temporal Considerations: Static snapshots don't account for driver turnover, seasonal operations, or changes in carrier size over the measurement period.
Multiple Event Attribution: Driver-based rates exceeding 100% indicate individual drivers can accumulate multiple OOS events, but the data doesn't track unique driver identities across events.
Two distinct measurement approaches were applied to this dataset:
- Inspection-based rate: The percentage of inspections that result in a driver being placed out-of-service
- Driver-based rate: OOS events calculated as a percentage of total drivers in the fleet
The Critical Role of Data Quality
Initial analysis of this dataset revealed a fundamental challenge: extreme outliers that distorted the entire analytical landscape. Some carriers showed driver-based rates exceeding 7,500%, with cases representing clear data anomalies rather than operational reality.
Using rigorous outlier controls (driver-based rates ≤200%, inspection-based rates ≤100%, minimum 3 inspections), the analysis removed 271,280 extreme outliers representing 48.2% of carriers. This substantial cleaning effort had significant interpretive impact while preserving the core patterns:
| Category | Before Filtering | After Filtering | Improvement |
|---|---|---|---|
| Maximum driver-based rate | 7,500% | 200% | Realistic ceiling |
| Data reliability | Poor | High | Credible results |
| Analysis validity | Questionable | Strong | Actionable insights |
The pattern reveals that larger and more established carriers showed minimal outlier contamination, while smaller and newer carriers had significant data quality issues.
Age: The Primary Predictor
Carrier age emerged as a dramatic predictor of driver OOS performance, with a clear maturation gradient:
| Age Category | Carriers | Inspection-Based Rate | Driver-Based Rate |
|---|---|---|---|
| New (< 1 year) | 15,634 | 10.8% | 32.3% |
| Young (1-3 years) | 51,867 | 9.3% | 31.0% |
| Established (3-10 years) | 102,715 | 7.6% | 22.5% |
| Mature (10-20 years) | 65,375 | 6.5% | 15.0% |
| Veteran (20+ years) | 56,135 | 4.5% | 8.1% |
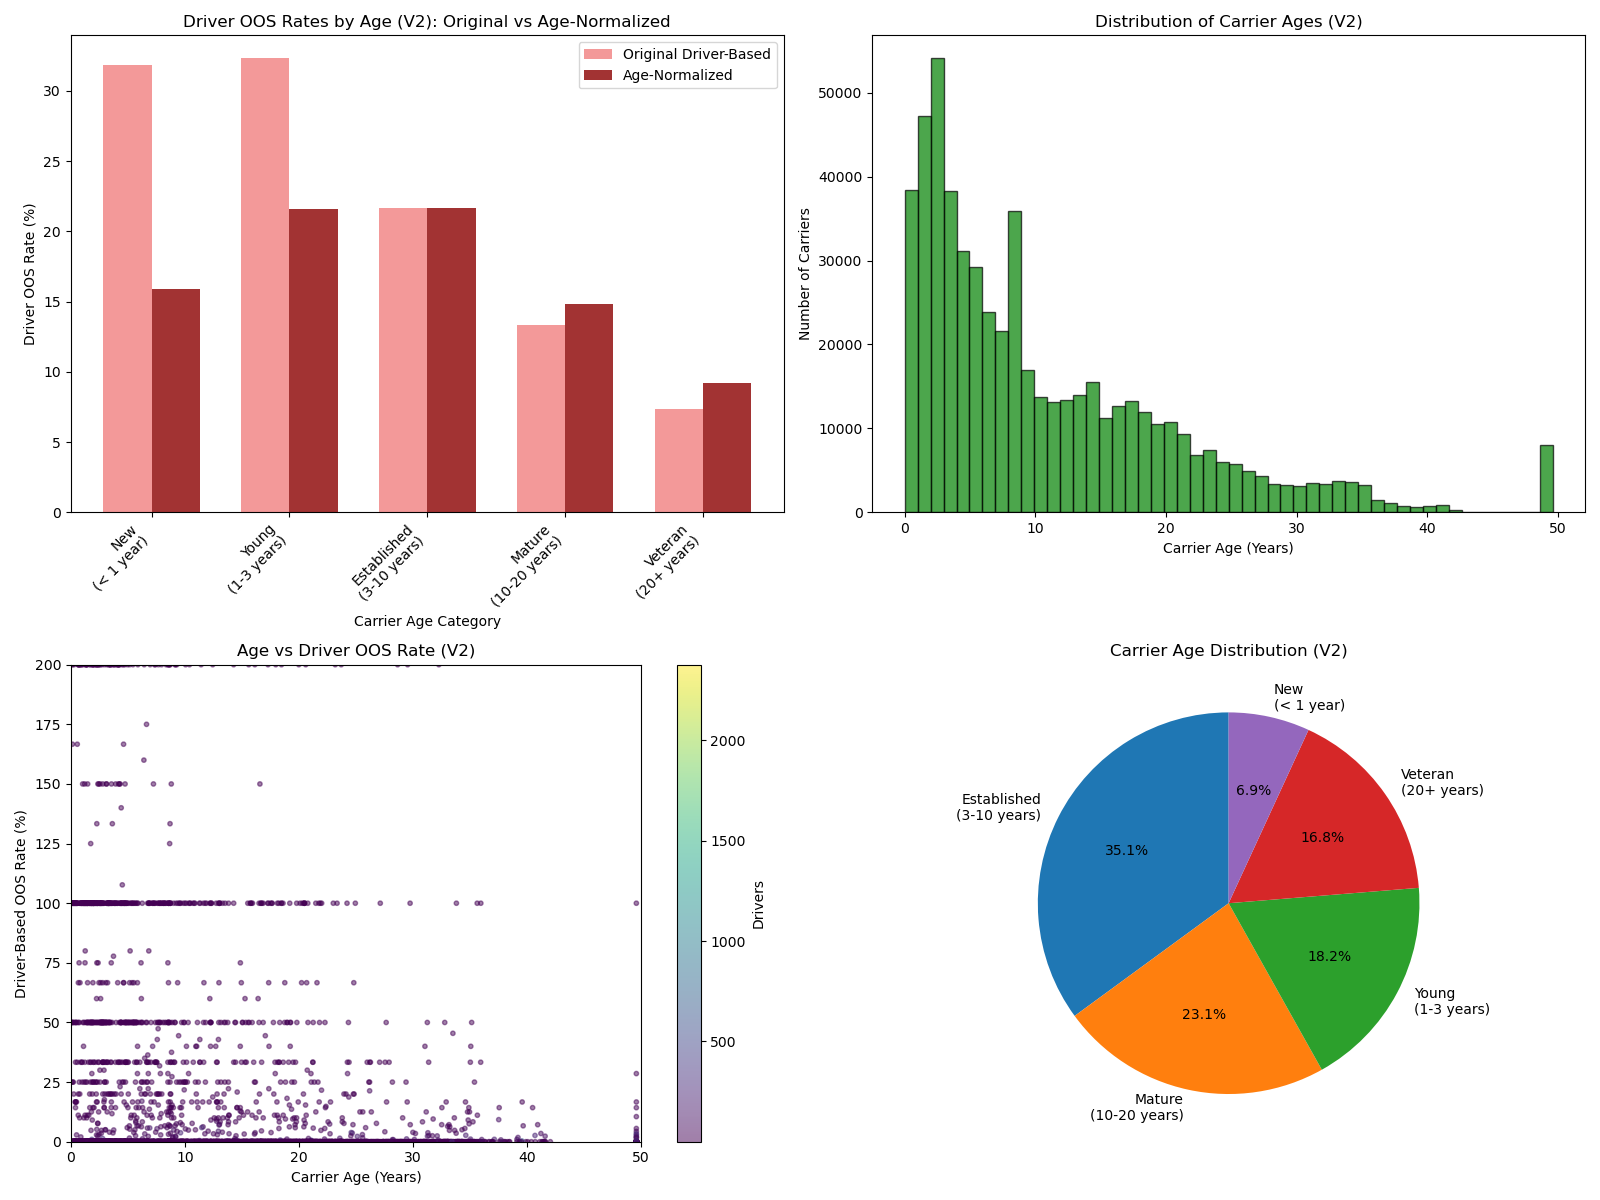
New carriers show 4x higher driver-based OOS rates compared to veteran carriers, suggesting a significant learning curve in compliance management. This age effect, however, interacts with another powerful predictor.
Fleet Size: The Amplifying Factor
Fleet size continues to show strong correlation with safety performance:
| Fleet Size | Carriers | Inspection-Based Rate | Driver-Based Rate |
|---|---|---|---|
| Small (1-5) | 197,314 | 8.0% | 26.2% |
| Medium (6-25) | 69,820 | 6.4% | 8.8% |
| Large (26-100) | 18,882 | 4.2% | 3.5% |
| Very Large (101-500) | 4,861 | 3.0% | 1.7% |
| Mega (500+) | 849 | 2.2% | 0.7% |
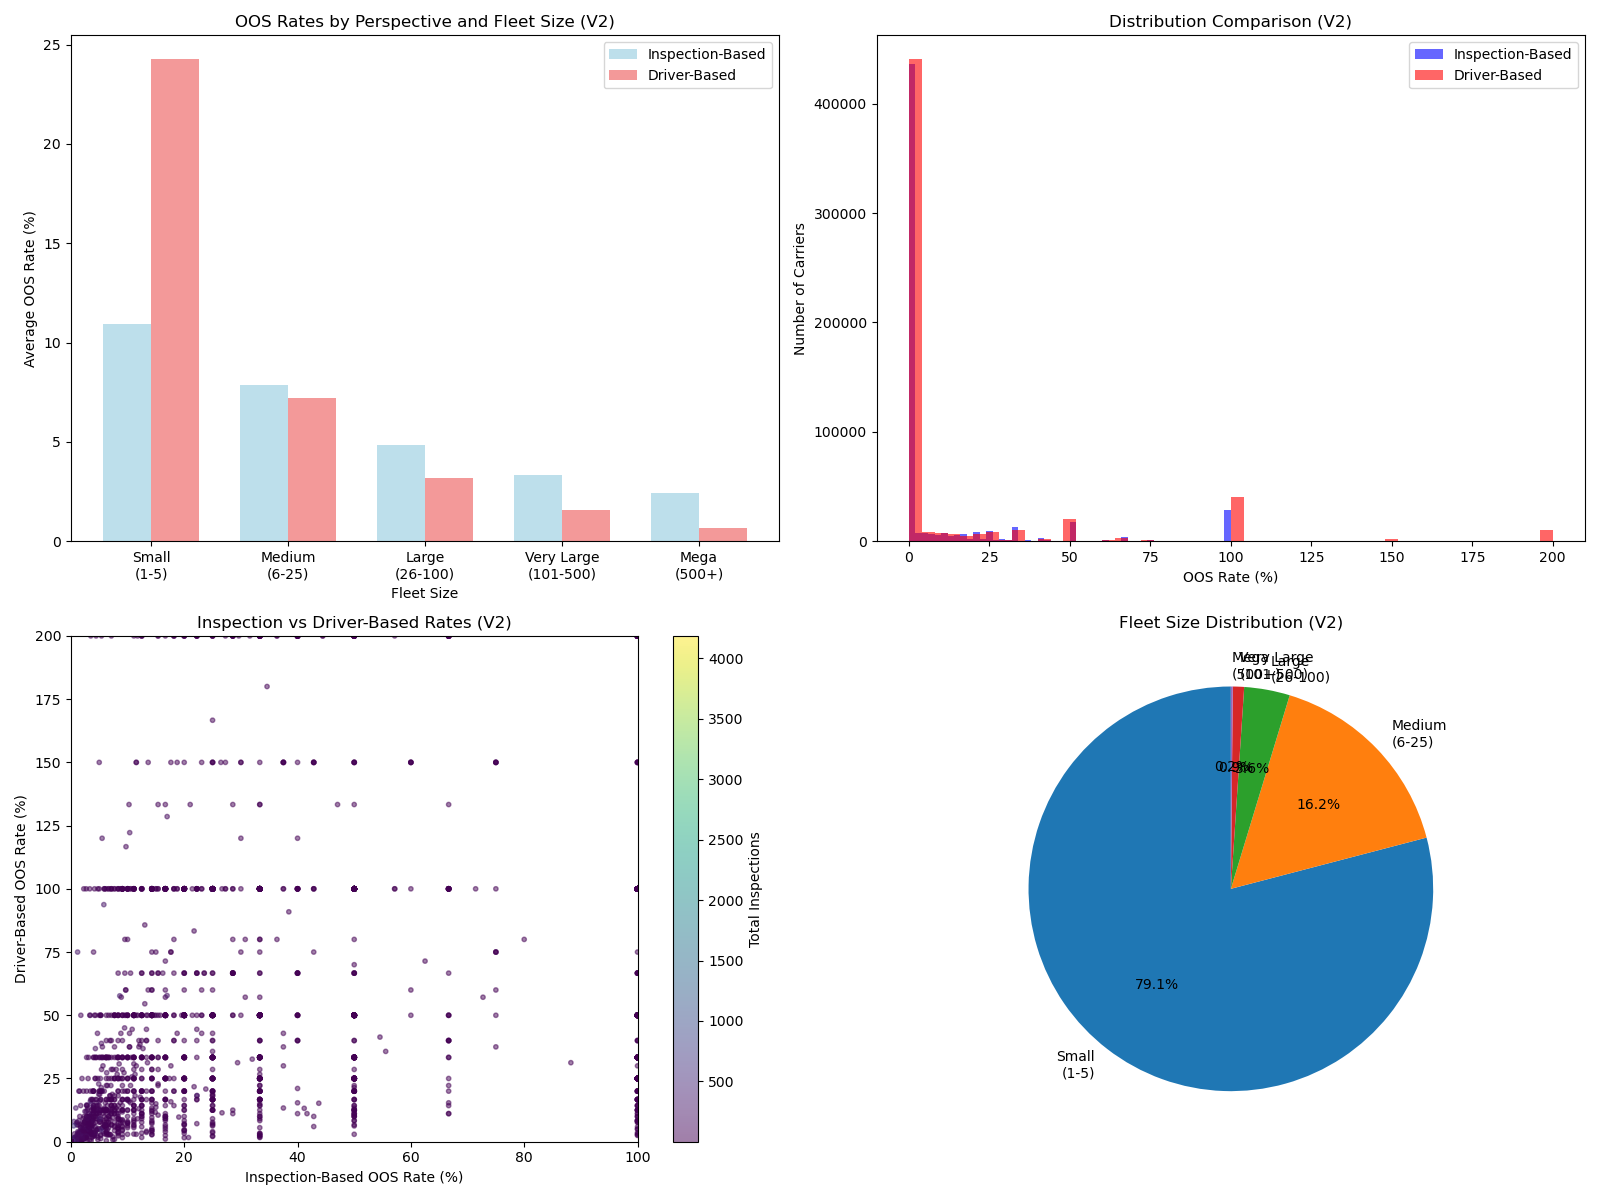
The size effect (37x difference between small and mega fleets) actually exceeds the age effect (4x difference), suggesting operational scale provides significant advantages in compliance management. However, these aggregate statistics mask an important underlying pattern.
The Median Reality: Most Carriers Are Compliant
Perhaps the most significant finding is that every single age and size category shows a 0% median OOS rate. This means the majority of carriers across all categories maintain clean driver safety records.
The high averages that dominate safety discussions are driven by a concentrated minority of problematic carriers rather than systemic industry-wide compliance issues. This distribution pattern has significant implications for how safety performance should be interpreted and measured.
Cross-Analysis: Where Age and Size Intersect
The intersection of age and fleet size reveals distinct carrier segments, each with different risk profiles. The most challenging segment - new small carriers - shows particularly elevated rates, while even veteran mega carriers maintain substantial advantages:
Most Challenging Segment (New Small Carriers):
- 32.3% driver-based rate
- 10.8% inspection-based rate
Best Performing Segment (Veteran Mega Carriers):
- 0.7% driver-based rate
- 2.2% inspection-based rate
These statistical patterns translate into real operational differences across the industry.
Real-World Examples: When Scale Meets Compliance Challenges
While the data shows larger fleets generally perform better, some mega carriers still struggle with driver compliance. Among the largest operators (500+ drivers), several high-profile examples demonstrate that scale alone doesn't eliminate safety challenges:
- CloudTrucks LLC (Dallas, TX) - 655 drivers, 1,076 inspections, 10.4% driver-based rate
- Texas International Enterprises (Laredo, TX) - 600 drivers, 1,397 inspections, 8.7% driver-based rate
- KAL Freight Inc (Arlington, TX) - 600 drivers, 408 inspections, 5.5% driver-based rate
- RoadPulse Logistics LLC (Lyons, IL) - 510 drivers, 496 inspections, 5.3% driver-based rate
- Western Express Inc (Nashville, TN) - 4,390 drivers, 13,763 inspections, 5.1% driver-based rate
- Transport Indiana LLC (Elkhart, IN) - 2,036 drivers, 1,994 inspections, 4.9% driver-based rate
- Greatwide American Trans-Freight (Langhorne, PA) - 622 drivers, 973 inspections, 4.8% driver-based rate
These examples validate that compliance challenges persist across all fleet sizes, with substantial inspection volumes confirming these represent genuine operational patterns rather than statistical noise.
Alternative Measurement Implications
The clean data analysis suggests several refined approaches:
Percentile-Based Benchmarking: Instead of comparing carriers to inflated averages, compare them to peer percentiles within their age/size category.
Binary Compliance Classification: Since most carriers achieve 0% rates, focus on "problem carrier" percentages rather than average rates.
Concentration Analysis: Measure what percentage of total OOS events stem from the worst-performing carriers to understand how concentrated safety issues really are.
Age-Adjusted Performance: Normalize expectations based on carrier maturity, recognizing that new carriers face genuine learning curves in compliance management.
These alternative approaches could significantly improve how the industry measures, compares, and improves driver safety performance.
Implications for Safety Analysis
This comprehensive analysis reveals that driver OOS measurement is far more nuanced than traditional approaches suggest. The interplay between carrier age, fleet size, data quality, and measurement methodology creates a complex landscape that requires sophisticated interpretation.
The most significant finding is that safety issues are highly concentrated rather than broadly distributed. With most carriers across all categories maintaining 0% median OOS rates, the challenge becomes identifying and addressing the minority of problematic operators rather than implementing broad-based industry interventions.
The age gradient proves particularly important for fair assessment. New carriers showing 32.3% average driver-based rates face fundamentally different challenges than veteran carriers with 8.1% rates. This suggests regulatory approaches should account for organizational maturity, with different expectations and interventions for carriers at different lifecycle stages.
Fleet size effects (37x difference between small and mega carriers) significantly exceed age effects (4x difference), indicating that operational scale provides substantial advantages in compliance management. However, the mega fleet examples demonstrate that size alone doesn't guarantee success - even carriers with thousands of drivers can face significant compliance challenges.
For enforcement officials, these insights suggest targeting resources toward the concentrated problem segments rather than broad oversight. For industry analysts, the analysis emphasizes the critical importance of data cleaning, appropriate peer group comparisons, and multiple measurement perspectives when evaluating carrier performance.
The convergence of inspection-based and driver-based rates among larger, more established carriers indicates these segments provide the most reliable data for analysis, while smaller and newer carriers require more careful interpretation of both metrics and underlying data quality.
Analysis based on federal commercial vehicle inspection records covering 5.5 million inspections and 250,252 OOS events, with comprehensive outlier analysis and age-enhanced segmentation across 291,726 carriers.