One Year Into the English Language Crackdown: What 56,000 Violations Reveal
Seven months after FMCSA began placing drivers out-of-service for English proficiency violations, we revisit the data. 45,766 violations in 2025 vs. 2,389 in 2024 - and the patterns reveal exactly who's getting hit hardest.
Back in August, [we analyzed 22,260 English proficiency violations](https://research.runalphaloop.com/english-proficiency-violations-surged-months-before-fatal-florida-accident/) and found that enforcement had surged months before the fatal Florida accident that brought national attention to the issue. The data showed a clear inflection point in January 2025 when the Trump administration took office.
Now, one year into the crackdown, we have a much fuller picture. Our updated dataset contains over 56,000 violations - more than double what we analyzed in August. The patterns we identified then have only intensified, and new geographic and carrier-size insights reveal exactly who's bearing the brunt of this enforcement push.
A Quick Refresher: What Changed in 2025
For nearly a decade, English language proficiency violations were a footnote. Under 2016 FMCSA guidance, inspectors could cite drivers for 391.11(b)(2) violations but couldn't place them out-of-service. Translation tools, interpreters, and cue cards were permitted during inspections.
That changed on April 28, 2025, when President Trump signed Executive Order 14286 - "Enforcing Commonsense Rules of the Road for America's Truck Drivers" - directing FMCSA to rescind the 2016 guidance and restore strict enforcement. Transportation Secretary Sean Duffy moved quickly, issuing new enforcement guidance on May 20 that eliminated accommodations and instructed inspectors to place non-compliant drivers out-of-service immediately. By June 25, the new out-of-service criteria took effect.
The Numbers Tell the Story
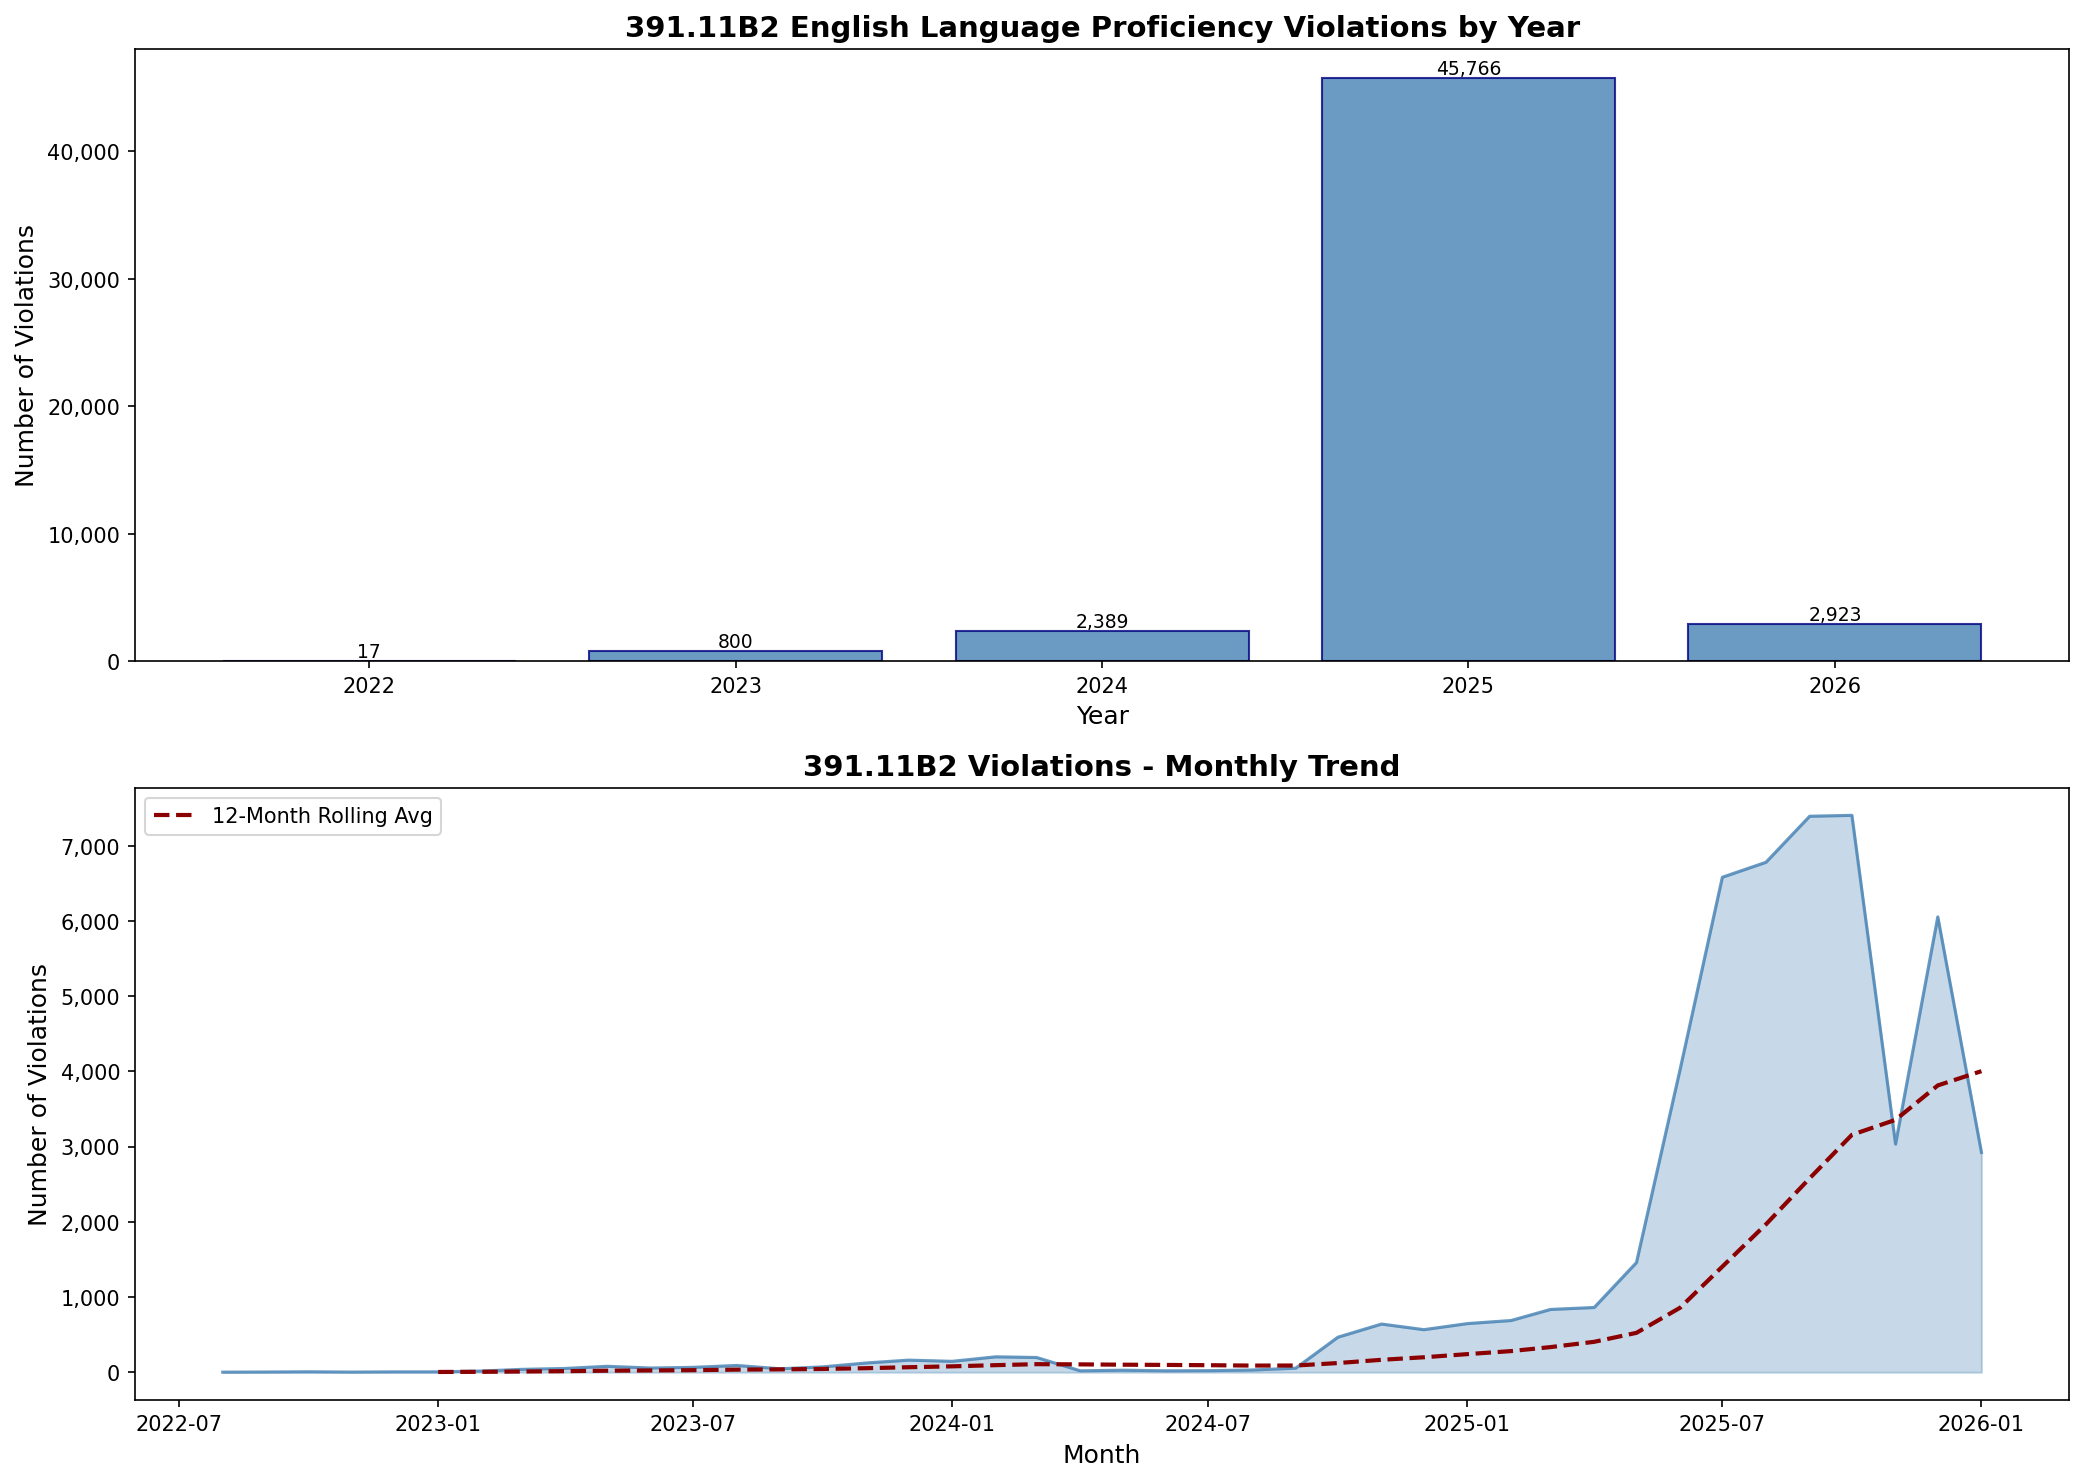
Our data shows violations essentially flat through 2024-just 2,389 for the entire year. Then came June 2025. In the seven months since enforcement changed, we recorded 45,766 violations-a 19x increase over the prior year's total. The monthly trend tells the story clearly: a near-vertical climb starting in mid-2025, with the 12-month rolling average surging from near-zero to nearly 4,000 violations per month.
And it's not slowing down. The 2026 data (through mid-January) already shows 2,923 violations-on pace to potentially exceed 2025's total if enforcement intensity holds.
Secretary Duffy announced in October that over 7,200 drivers had been placed out-of-service. By December, Bloomberg's analysis put that figure above 9,500. Our violation data aligns with these reports-this is sustained enforcement, not a one-time crackdown.
The Border Effect: Where Enforcement Hits Hardest
If you're running cross-border freight, this data should have your full attention.
State-Level Findings
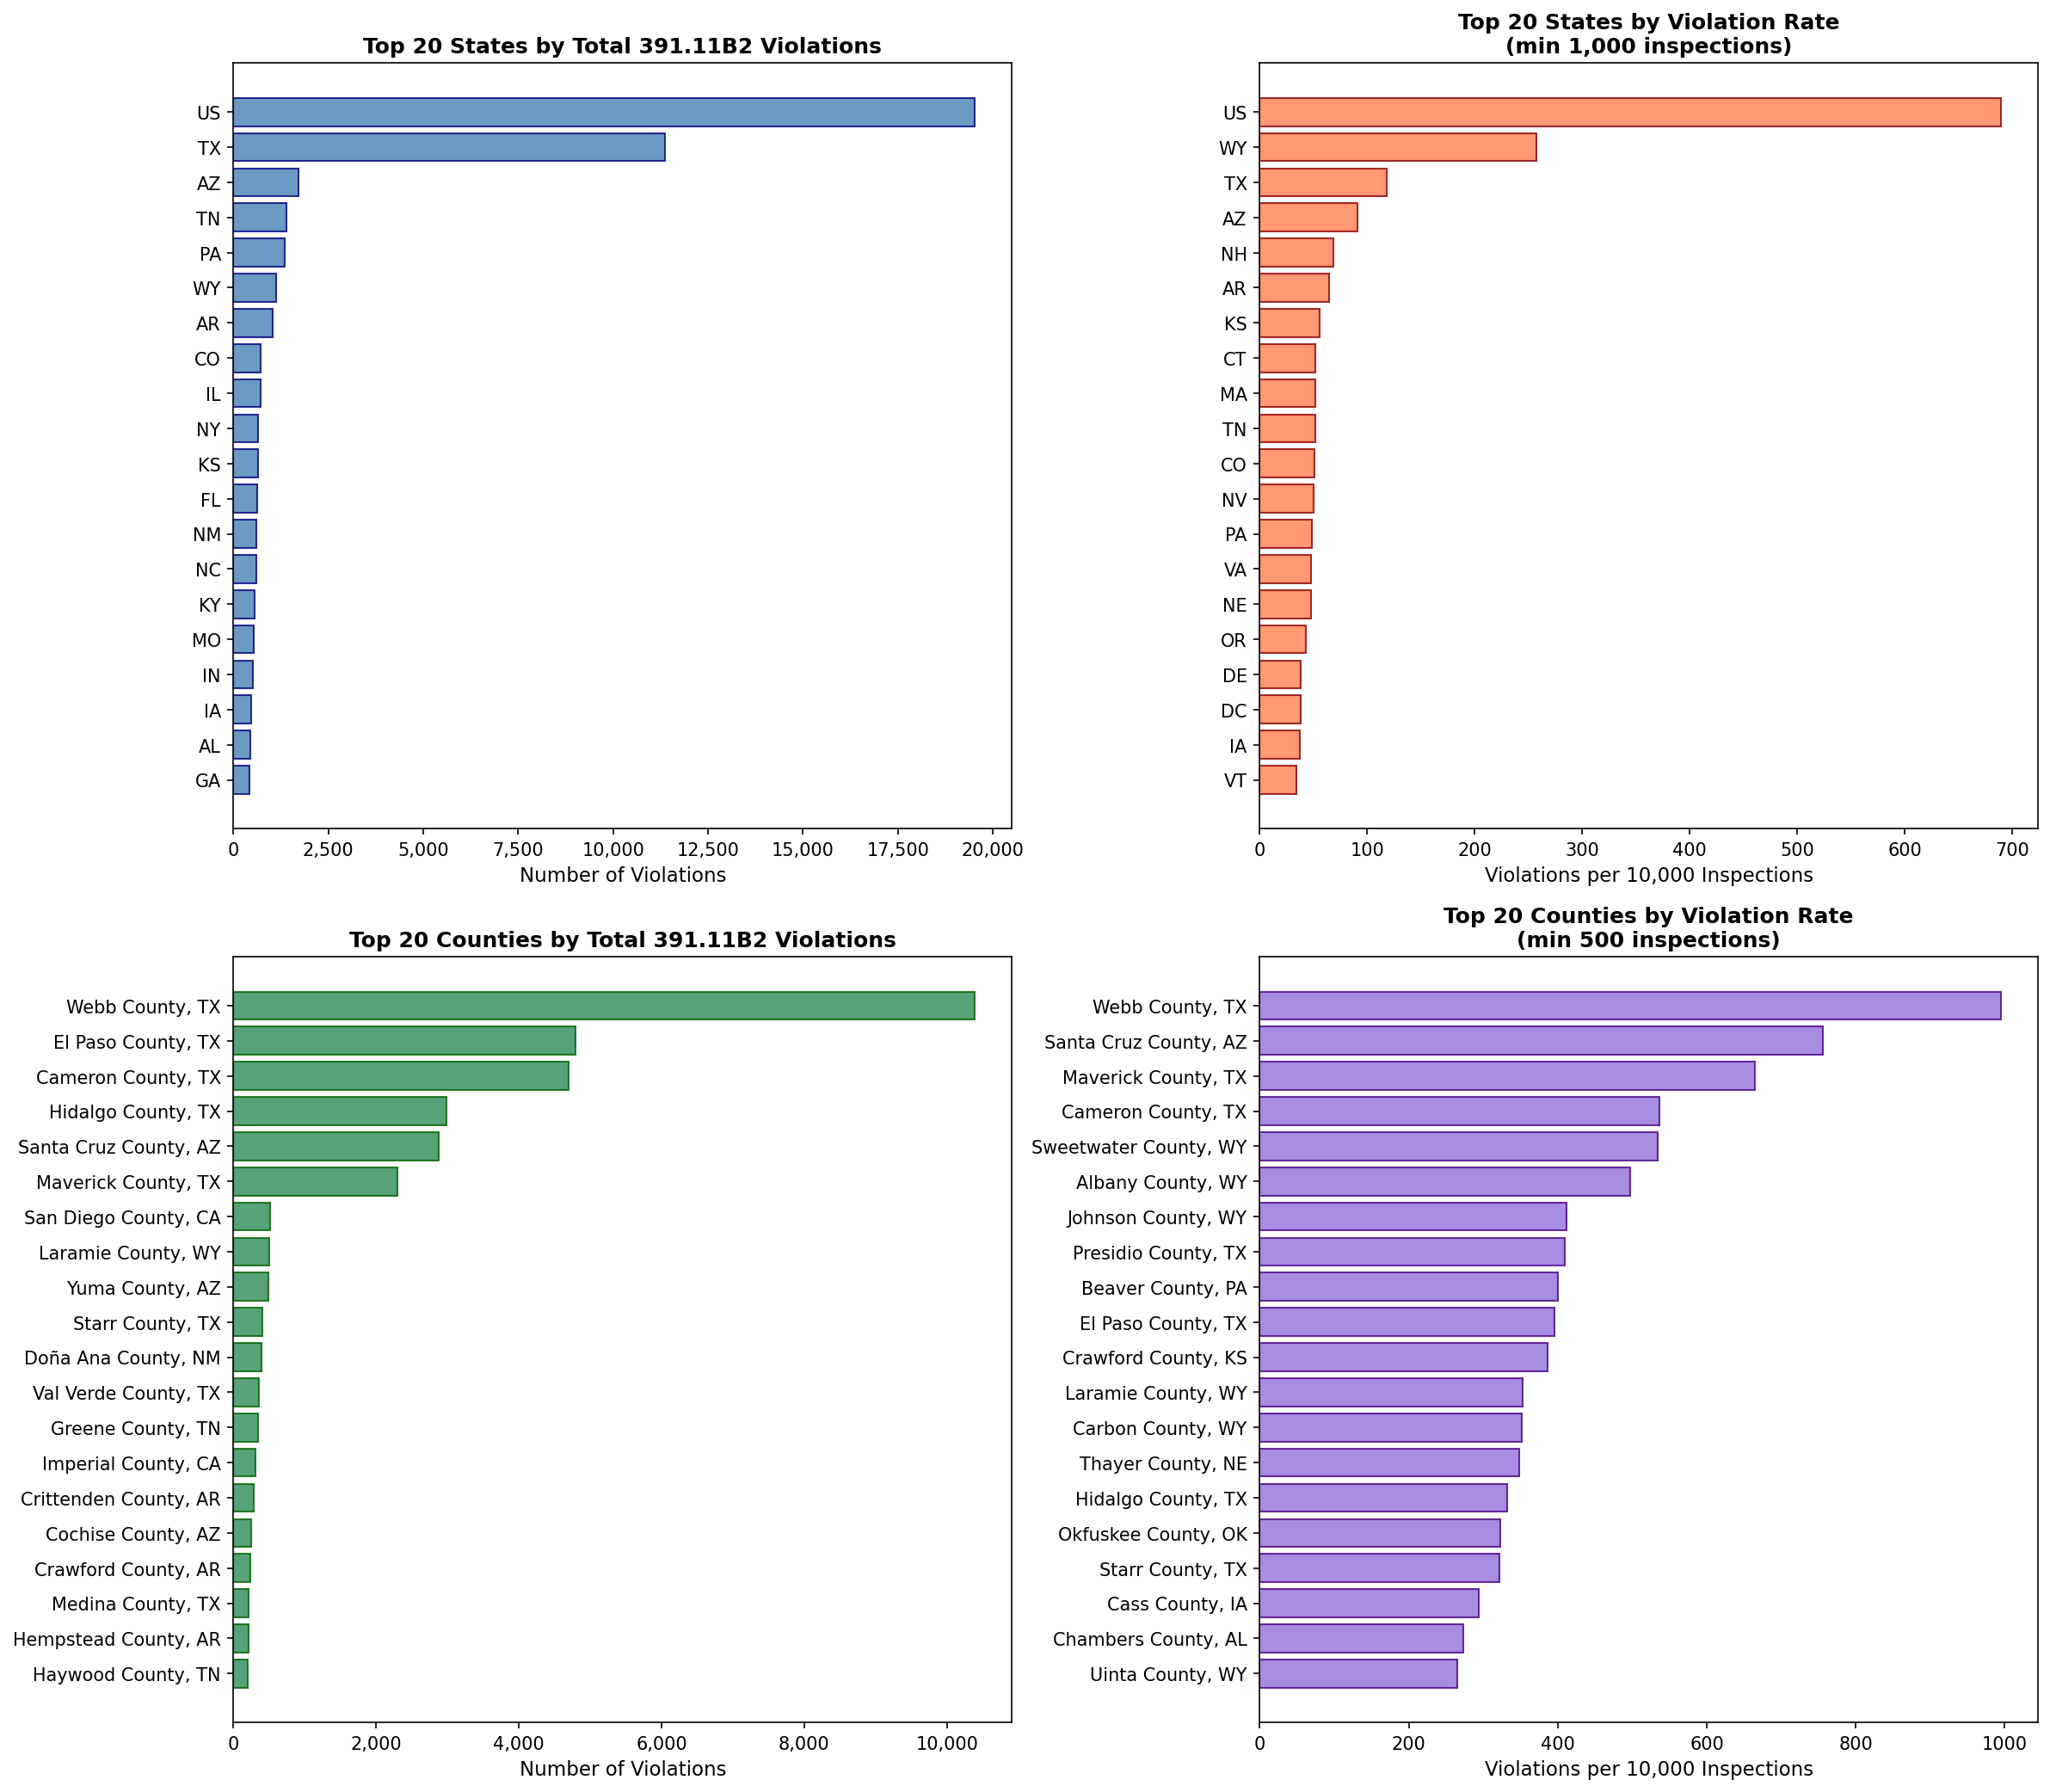
Texas dominates in absolute terms with 11,374 violations-roughly 22% of all 391.11(b)(2) violations nationwide. But the rate tells a more nuanced story:
| State | Total Violations | Rate per 10K Inspections |
|---|---|---|
| Wyoming | 1,115 | 257.5 |
| Texas | 11,374 | 118.2 |
| Arizona | 1,705 | 91.3 |
| New Hampshire | 174 | 68.7 |
| Arkansas | 1,035 | 64.7 |
Wyoming's violation rate is more than double Texas's-likely reflecting its position as a key corridor for north-south freight and aggressive enforcement posture.
The County Story Is Even More Striking
When we drill down to county level, the border concentration becomes unmistakable:
| County | State | Violations | Rate per 10K |
|---|---|---|---|
| Webb County (Laredo) | TX | 10,390 | 994.8 |
| Santa Cruz County | AZ | 2,875 | 756.5 |
| Maverick County | TX | 2,302 | 665.2 |
| Cameron County | TX | 4,693 | 536.7 |
| El Paso County | TX | 4,792 | 395.6 |
Webb County alone accounts for nearly 1 in 5 of all English proficiency violations in the country. With Laredo being the #1 international gateway for U.S.-Mexico trade ($214 billion annually), the concentration makes sense-but the enforcement intensity is remarkable. At a rate of nearly 995 violations per 10,000 inspections, roughly 10% of all inspections in Webb County result in an ELP violation.
The pattern is clear: if you're operating Mexico-domicile carriers or running cross-border freight through Texas and Arizona, ELP compliance is no longer optional-it's existential.
Who's Getting Hit: Carrier Size Analysis
The carrier size data reveals a pattern that should concern owner-operators and small fleets in particular.
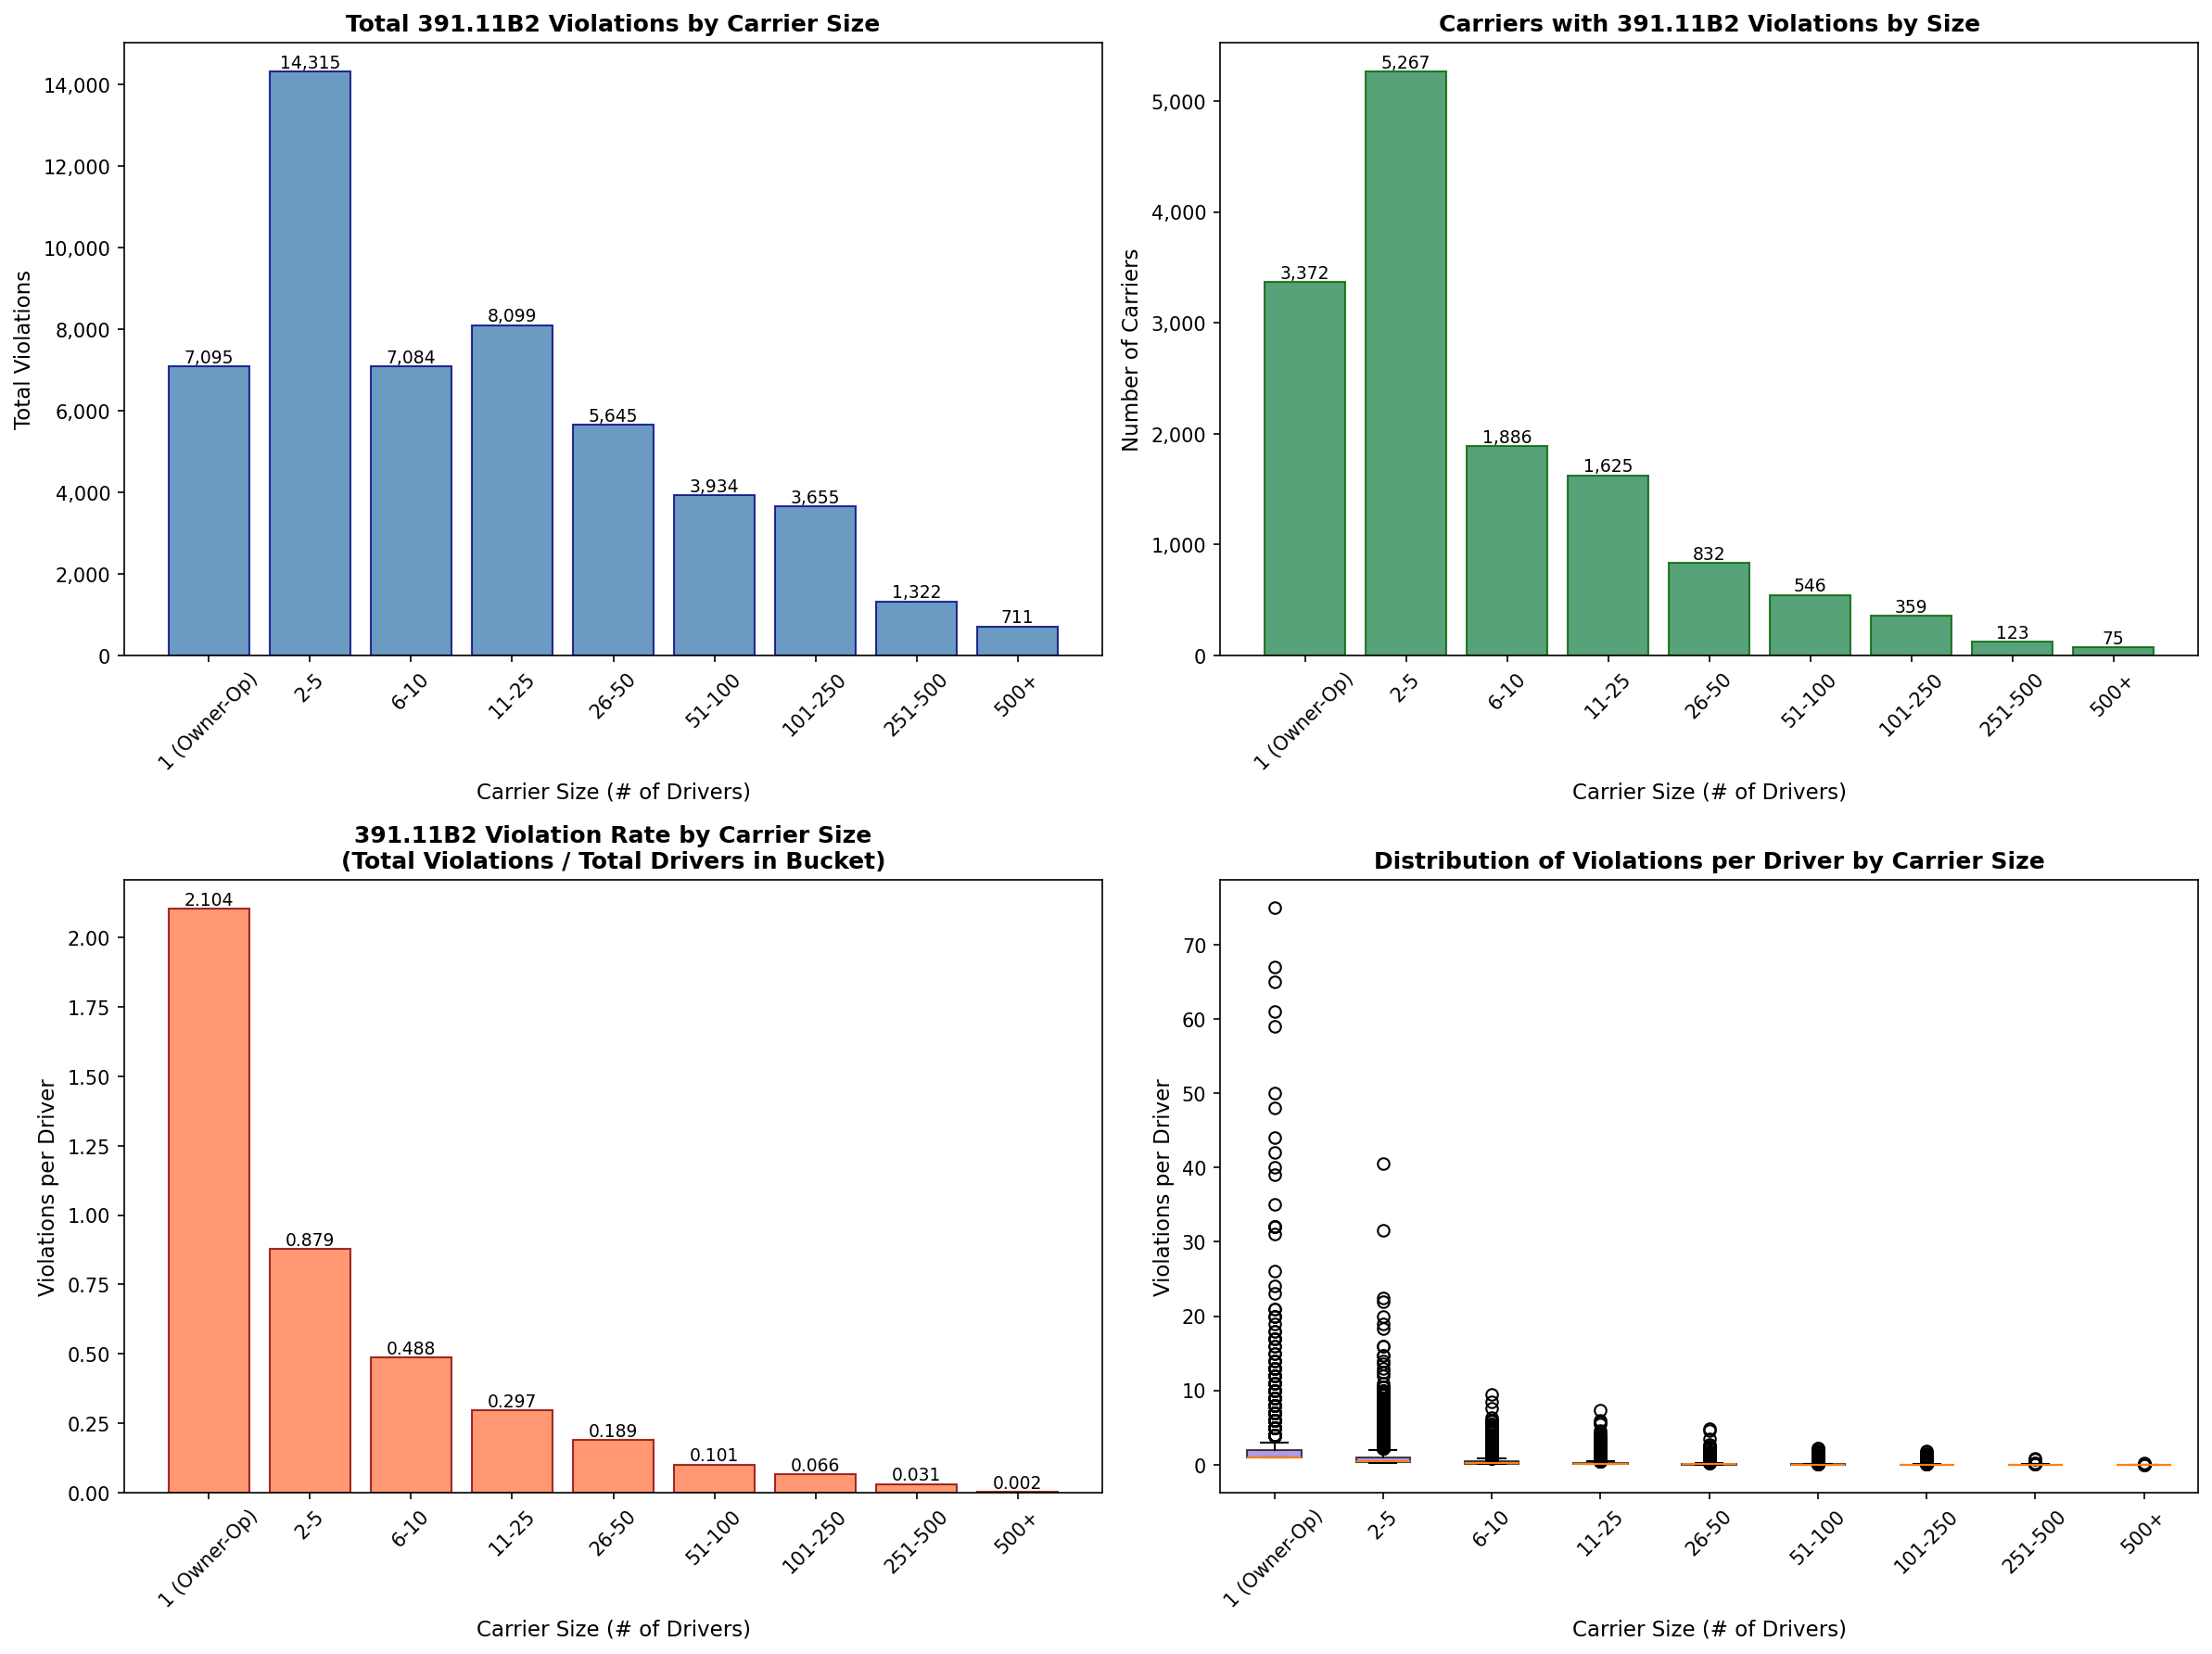
Violations Per Driver by Fleet Size
| Fleet Size | Carriers | Total Violations | Violations per Driver |
|---|---|---|---|
| 1 (Owner-Op) | 3,372 | 7,095 | 2.10 |
| 2-5 drivers | 5,267 | 14,315 | 0.88 |
| 6-10 drivers | 1,886 | 7,084 | 0.49 |
| 11-25 drivers | 1,625 | 8,099 | 0.30 |
| 26-50 drivers | 832 | 5,645 | 0.19 |
| 51-100 drivers | 546 | 3,934 | 0.10 |
| 500+ drivers | 75 | 711 | 0.002 |
Owner-operators have a violation rate 1,000 times higher than large fleets on a per-driver basis. This isn't surprising-larger carriers have more resources for compliance screening, training programs, and the ability to route drivers strategically. But the magnitude of the gap is striking.
The Repeat Offenders
Some carriers are accumulating violations at alarming rates. Among the worst offenders in each size category:
1 driver:
- SUPLICIUM TRANSPORT LLC: 75 violations
- PASADA LLC: 67 violations
- AUTO HAUL EXPRESS LLC: 65 violations
2-5 drivers:
- SAKARA LLC: 81 violations (40.5 per driver)
- MARCOS DE LOS REYES: 63 violations (31.5 per driver)
- JAIME MARTINEZ SOLIS: 45 violations (22.5 per driver)
6-25 drivers:
- AMPARO GUADALUPE BANDA GONZALEZ (10 drivers): 95 violations (9.5 per driver)
- JESUS ESTEBAN LUGO PINALES (12 drivers): 88 violations (7.3 per driver)
- AUTOTRANSPORTE CA-RI SA DE CV (10 drivers): 85 violations (8.5 per driver)
- TRANSPORTE INTERNACIONAL LOPEZ OCHOA SA DE CV (25 drivers): 142 violations (5.7 per driver)
26-100 drivers:
- MP EXPRESS LOGS SA DE CV (39 drivers): 187 violations (4.8 per driver)
- QUALITY TANK SA DE CV (80 drivers): 177 violations (2.2 per driver)
- RS TRANSFER SA DE CV (60 drivers): 133 violations (2.2 per driver)
- BRANDON SALAZAR SNOWBALL (26 drivers): 121 violations (4.7 per driver)
101-500 drivers:
- TRANSPORTADORA NORTE DE CHIHUAHUA SA DE CV (133 drivers): 244 violations (1.8 per driver)
- SERVICIO INTERNACIONAL DE ENLACE TERRESTRE SA DE CV (152 drivers): 260 violations (1.7 per driver)
- TRANSPORTES DE CARGA FEMA SA DE CV (290 drivers): 234 violations (0.8 per driver)
- OPERADORA DE TRANSPORTE INTERNACIONAL SA DE CV (302 drivers): 206 violations (0.7 per driver)
500+ drivers:
- TEXAS INTERNATIONAL ENTERPRISES INC (600 drivers): 115 violations (0.19 per driver)
- SELECT DEDICATED SOLUTIONS LLC (658 drivers): 102 violations (0.16 per driver)
- TRANS-MEX INC SA DE CV (842 drivers): 105 violations (0.12 per driver)
The pattern is consistent with Transportation Secretary Sean Duffy's assertion that over 9,500 drivers have been placed out-of-service since June 2025-and the geographic distribution suggests cross-border operations are bearing the brunt.
For the Data-Driven
We'll continue tracking this enforcement trend. The 25% out-of-service rate on ELP violations (up from 0.1% pre-June 2025) represents a sea change in how this regulation affects daily operations.
The Bottom Line
One year in, it's clear: the English language proficiency crackdown isn't a blip - it's a structural shift in enforcement philosophy. After a decade of essentially symbolic enforcement, 391.11(b)(2) now carries real operational consequences.
The data is clear:
- 45,766 violations in 2025 vs. 2,389 in 2024, with the bulk coming after June's out-of-service rule took effect
- Webb County, TX alone accounts for 20% of all violations
- Owner-operators face violation rates 1,000x higher than large fleets
- 25% of flagged drivers are now placed out-of-service (vs. 0.1% pre-crackdown)
When the enforcement shift happened last June, some carriers took a wait-and-see approach. Seven months of data suggests that was a mistake. If you're operating in cross-border freight and haven't adjusted your compliance posture, the window for proactive action is closing.
Methodology Overview
This analysis examines violations of FMCSA regulation 391.11B2, which requires commercial motor vehicle drivers to be able to read and speak English sufficiently to communicate with the general public, understand highway traffic signs and signals, respond to official inquiries, and make entries on reports and records.
Data Sources
The analysis uses 3 FMCSA-related data sets and 2 geo reference sets.:
| File | Purpose | Key Fields |
|---|---|---|
inspections |
Roadside inspection records | inspection_id, insp_date, dot_number, report_state, county_code, county_code_state |
violations |
Violations cited during inspections | inspection_id, insp_violation_id, part_no, part_no_section, out_of_service_indicator |
carriers |
Motor carrier census data | dot_number, legal_name, drivers, power_units |
state_fips_lookup |
State abbreviation to FIPS mapping | state_abbrev, state_fips |
fips_coordinates |
County FIPS codes with names/coordinates | full_fips, county_name, latitude, longitude |
Data Linkage
violations ──(inspection_id)──► inspections ──(dot_number)──► carriers
                                     │
                                     ▼
                        state_fips + county_code
                                     │
                                     ▼
                              fips_coordinates
Step 1: Violation Filtering
Filter all_violations to records where:
part_no = '391'part_no_sectionstarts with'11b2'
This isolates violations of the English language proficiency requirement.
Step 2: Inspection Join
Link violations to inspections via inspection_id to obtain:
- Inspection date (
insp_date) - Location (
report_state,county_code,county_code_state) - Carrier identifier (
dot_number)
Step 3: Geographic Enrichment
- Convert
county_code_state(e.g., "TX") to state FIPS code (e.g., "48") usingstate_fips_lookup - Combine state FIPS (2 digits) +
county_code(3 digits) to create 5-digitfull_fips - Join to
fips_coordinatesto obtain county names and lat/long coordinates
Step 4: Carrier Enrichment
Join to carriers table via dot_number to obtain:
- Carrier name (
legal_name,dba_name) - Fleet size (
drivers,power_units)
AlphaLoop provides fleet intelligence to go-to-market teams in transportation, including violation tracking, carrier risk signals, and compliance monitoring. [Learn more about how we can help you identify carrier risk before it impacts your operations.]