The Market Share Battle: PACCAR Loses Ground to Freightliner During Freight Recession
New Q2 2025 data reveals PACCAR's continued market share decline against Freightliner's steady gains.

New Q2 2025 data reveals PACCAR's continued market share decline against Freightliner's steady gains.
Q2 2025 Market Share Performance
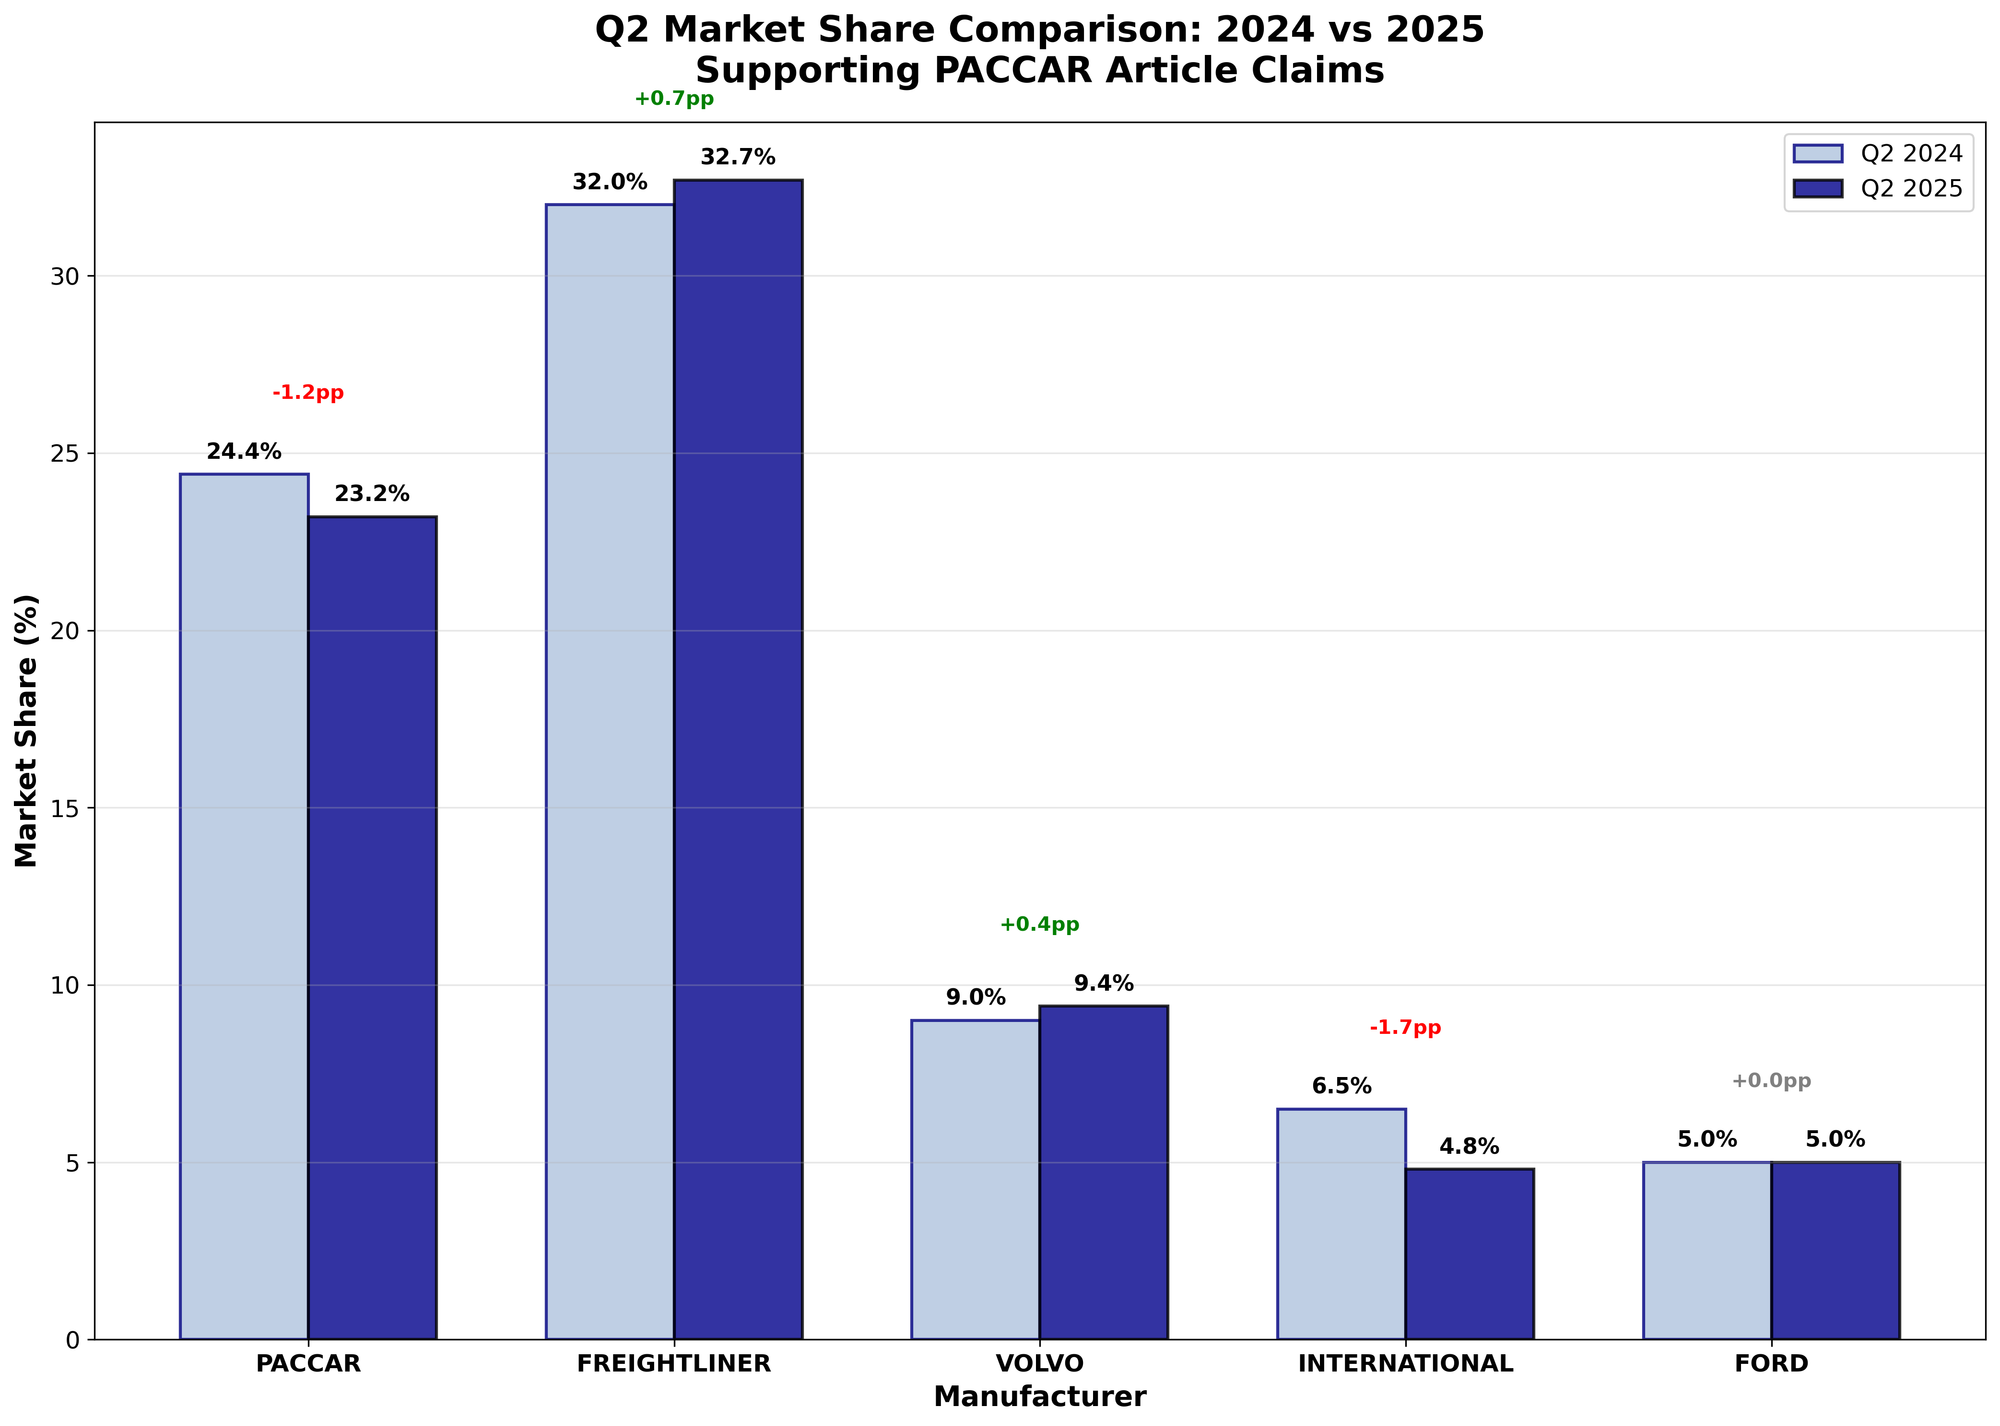
PACCAR dropped 1.2 percentage points year-over-year while Freightliner gained 0.7 percentage points.
- PACCAR: 24.4% (Q2 2024) → 23.2% (Q2 2025) = -1.2pp
- Freightliner: 32.0% (Q2 2024) → 32.7% (Q2 2025) = +0.7pp
- Market gap: Widened from 7.6pp to 9.5pp between the companies
- Other players: Volvo gained 0.4pp, International lost 1.7pp
Two-Year Trend Shows Accelerating Divergence
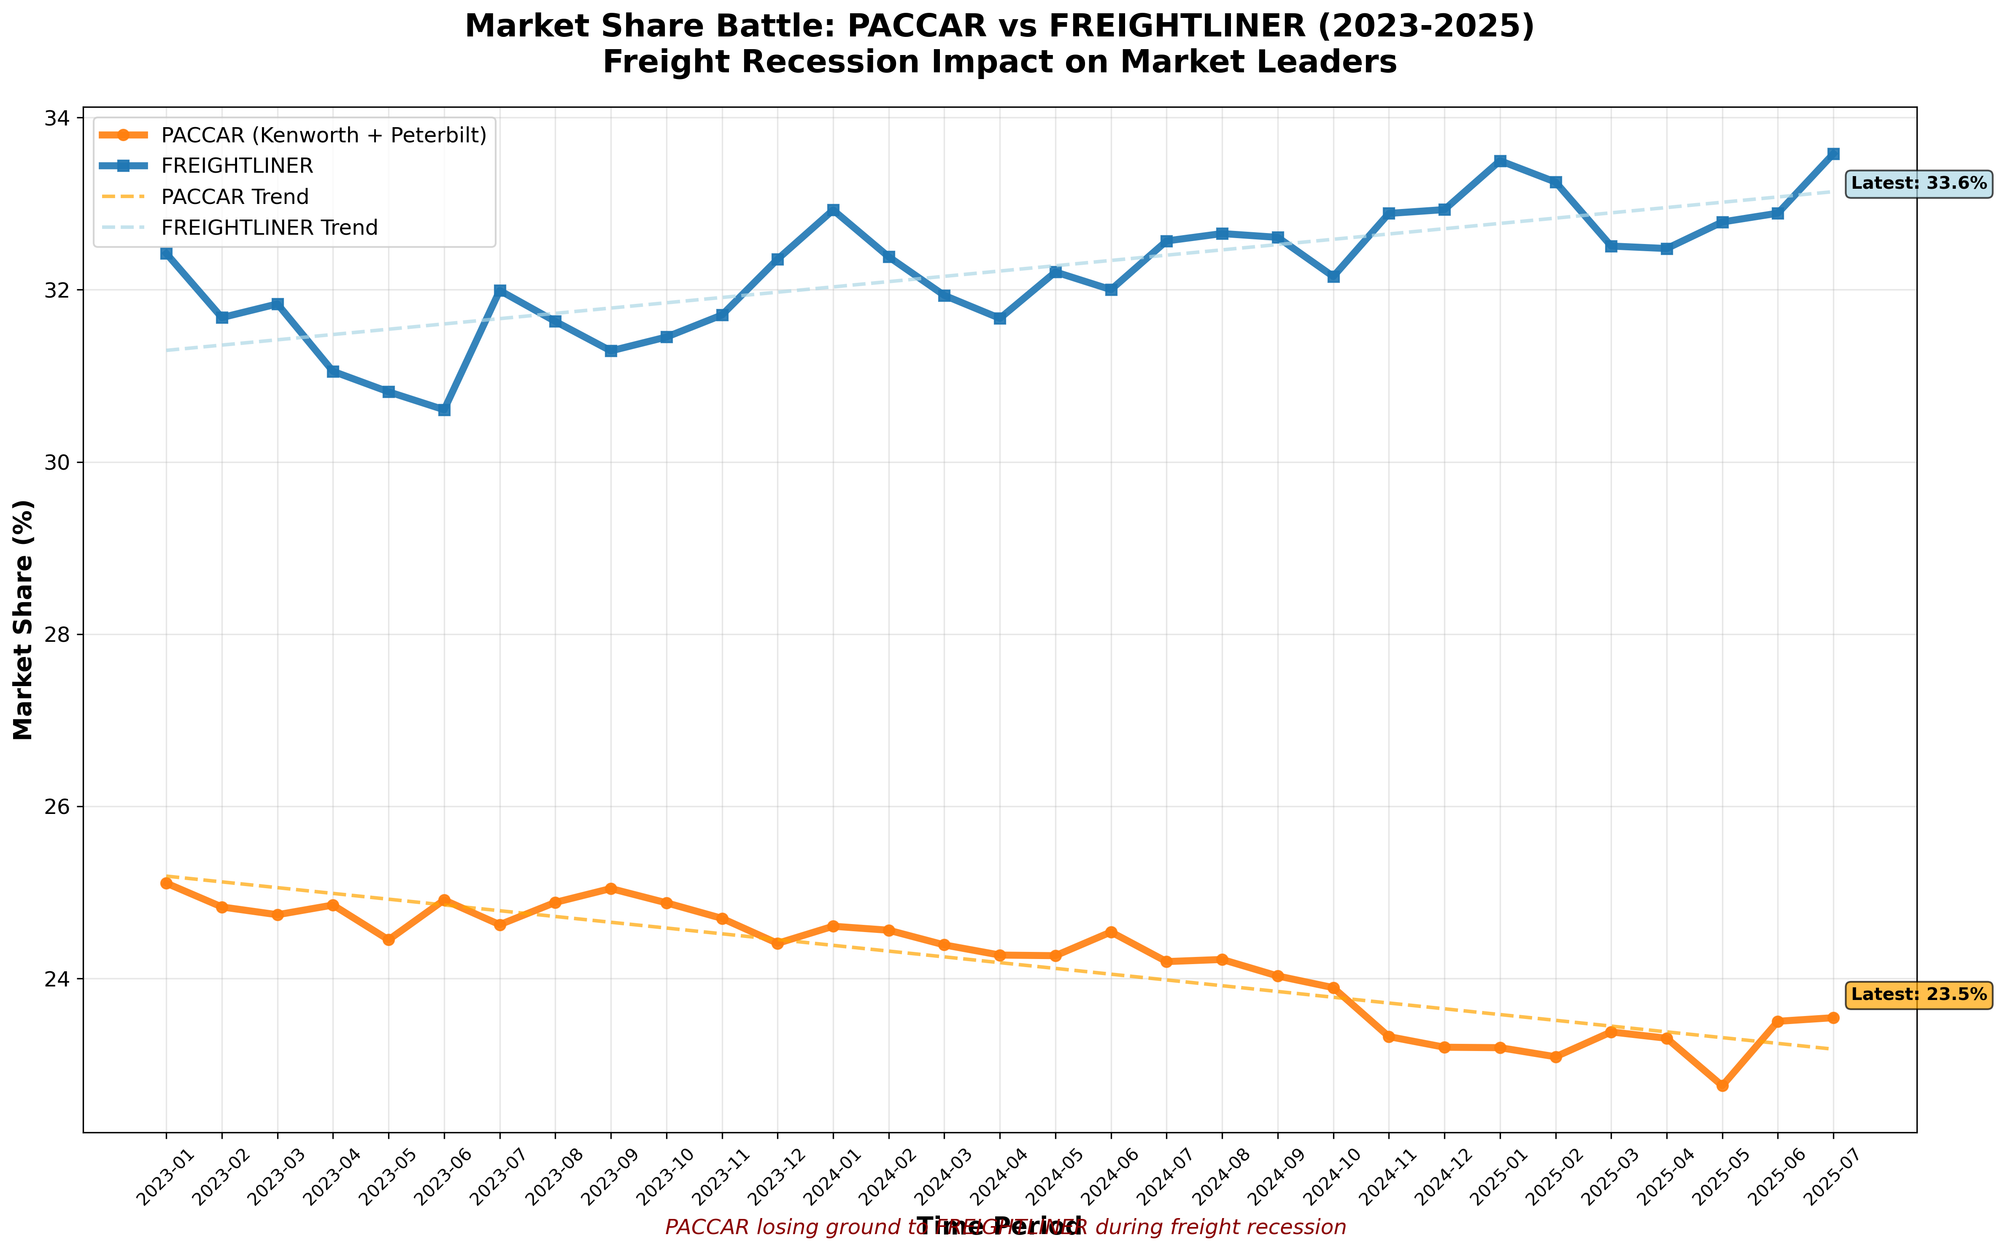
The 2023-2025 period demonstrates a consistent pattern of PACCAR decline and Freightliner growth.
- PACCAR overall decline: 1.6 percentage points from 2023 peak
- Freightliner overall gain: 1.5 percentage points from 2023 baseline
- Latest market share: Freightliner 33.6%, PACCAR 23.5%
- Trend direction: Diverging paths throughout the freight recession period
Market Share Rankings
Freightliner has extended its market leadership while PACCAR remains in second place.
- #1 Freightliner: 32.7% market share
- #2 PACCAR: 23.2% market share (Kenworth + Peterbilt combined)
- #3 Volvo: 9.4% market share
- #4 International: 4.8% market share
Timing Correlation with Freight Market
The market share shifts coincide with the ongoing freight recession period.
- Freight recession period: Identified as the timeframe when PACCAR losses accelerated
- Market pressure: Both companies faced reduced overall demand
- Performance difference: Freightliner maintained/grew share during downturn
- Timing: Most significant PACCAR losses occurred during economic stress period
Competitive Gap Analysis
The market share gap between the top two players has grown substantially.
- Q2 2024 gap: 7.6 percentage points
- Q2 2025 gap: 9.5 percentage points
- Gap increase: 1.9 percentage points in one year
- Trend: Consistent widening over the measurement period
Industry Concentration
Market share distribution shows increasing concentration among fewer players.
- Top 2 companies: Control 55.9% of total market
- Freightliner dominance: Nearly 1 in 3 trucks sold
- PACCAR position: Approximately 1 in 4 trucks sold
- Smaller players: International below 5% market share
Year-over-Year Performance Summary
Q2 2025 results show clear winners and losers in market position.
- Gained market share: Freightliner (+0.7pp), Volvo (+0.4pp)
- Lost market share: PACCAR (-1.2pp), International (-1.7pp)
- Net effect: Market share shifted toward larger players
Data Source and Methodology
Market share calculations based on Q2 quarterly data comparing 2024 vs 2025 performance.
- Measurement period: Q2 2024 vs Q2 2025
- PACCAR definition: Combined Kenworth and Peterbilt brands
- Market scope: Heavy-duty truck segment
- Data presentation: Percentage point changes and trend analysis
The data demonstrates a clear pattern of market share transfer from PACCAR to Freightliner during the current freight recession, with the competitive gap between these industry leaders continuing to widen in Freightliner's favor.


