Who's Buying 2026 Trucks? The Data Tells a Surprising Story
Who's buying 2026 trucks? Owner-operators are outpacing mid-sized fleets by 42%. Freightliner's Cascadia 126 leads with 7,664 units. And some carriers are refreshing 20%+ of their fleet while others sit below 1%.
Analyzing 46,000+ model year 2026 commercial vehicles to reveal which fleets are investing in new equipment—and what they're buying.
January 2026 · AlphaLoop Research · 4.1M trucks analyzed
The first model year 2026 trucks are hitting the road, and the data reveals fascinating patterns about who's investing in new equipment and which manufacturers are winning the battle for market share. We analyzed over 4 million commercial vehicles registered with the FMCSA to understand how 2026 models are being distributed across fleet sizes and what this means for the industry.
| Metric | Value |
|---|---|
| 2026 Trucks Identified | 46,585 |
| Share of Total Fleet | 1.63% |
| Fleets Analyzed | 826,000+ |
With 2026 trucks representing just 1.63% of the total truck population, we're still in the early days of this model year's rollout. For context, 2025 models currently make up 4.72% of the fleet, and 2024 models account for 8.49%. The distribution of these early 2026 purchases tells us which segments are most aggressive about fleet renewal.
The Manufacturer Landscape
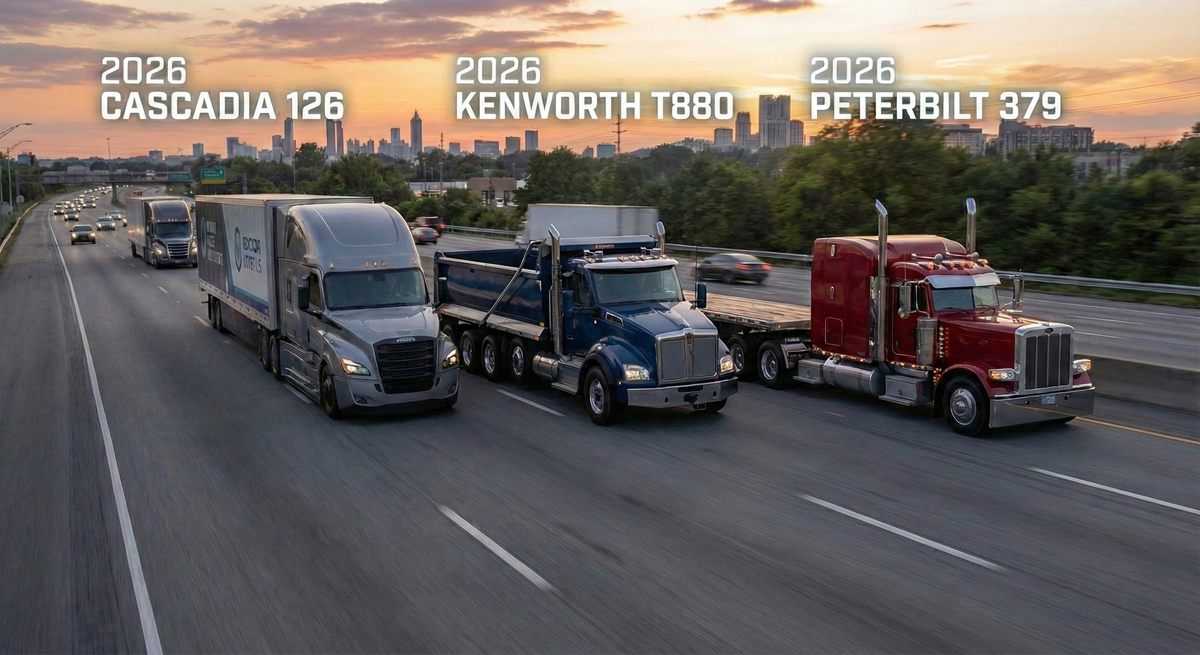
Freightliner continues to dominate the new truck market with nearly 18,000 model year 2026 units already on the road—capturing 38.4% of the 2026 market. The Cascadia 126 alone accounts for 7,664 units, making it far and away the most popular new truck in America.
| Manufacturer | 2026 Units |
|---|---|
| Freightliner | 17,902 |
| Kenworth | 8,250 |
| Peterbilt | 6,969 |
| International | 5,261 |
| Volvo | 2,478 |
| Mack | 2,211 |
| Ford | 1,427 |
| Western Star | 971 |
The Sprinter 3500 claims the second spot overall with 4,326 units—a testament to the continued growth of last-mile delivery and the gig economy. The vocational segment shows strong performance too, with the Kenworth T880 (3,782 units) and Peterbilt 379 (2,488 units) rounding out the top five.
Key Finding: Western Star leads all manufacturers in fleet "newness"—14.46% of all Western Star trucks on the road are 2024 or newer, compared to the industry average of around 10-11%. This suggests strong recent demand in vocational and heavy-haul segments where Western Star competes.
Small Fleets Lead Early Adoption
Here's what surprised us most: small fleets (1-5 trucks) account for 37% of all 2026 truck purchases, despite representing a smaller share of total industry capacity. These owner-operators and small carriers are investing aggressively in new equipment.
| Fleet Size | 2026 Trucks | % of Fleet | # of Fleets |
|---|---|---|---|
| 1-5 trucks | 17,299 | 1.38% | 717,594 |
| 6-20 trucks | 8,085 | 0.97% | 85,010 |
| 21-50 trucks | 4,308 | 0.88% | 15,910 |
| 51-100 trucks | 3,551 | 1.05% | 4,893 |
| 101-500 trucks | 5,970 | 1.03% | 3,082 |
| 500+ trucks | 7,372 | 1.10% | 416 |
The mega-carriers (500+ trucks) come in second with 7,372 units. The mid-market (21-50 trucks) shows the lowest renewal rate at just 0.88%—these fleets may be more cautious about capital expenditure or focused on other operational priorities.
Owner-operators are buying 2026 trucks at a 42% higher rate than mid-sized fleets—signaling confidence in the freight market despite economic uncertainty.
Fleets With the Highest 2026 Adoption
Some carriers are renewing at rates that dwarf the 1.63% industry average. These are the fleets investing most aggressively in new equipment right now:
| Carrier | 2026 Trucks | Total Fleet | % 2026 |
|---|---|---|---|
| Cadence Premier Cargo | 189 | 820 | 23.1% |
| Victory Driveaway | 155 | 790 | 19.6% |
| Auto Truck Transport USA | 110 | 605 | 18.2% |
| Active USA | 100 | 556 | 18.0% |
| Dealers Choice Truckaway | 280 | 2,029 | 13.8% |
| Norton Transport | 181 | 1,581 | 11.5% |
| Quality Drive Away | 130 | 1,264 | 10.3% |
These carriers are refreshing 10-23% of their fleets with 2026 models—10x the industry average. The reasons vary: some run vehicle transport operations where newer equipment is table stakes, others are executing deliberate fleet modernization strategies. Whatever the driver, these are fleets actively writing checks for new trucks.
Enterprise Buyers Making Moves
Among the largest traditional carriers, several household names are investing heavily in 2026 equipment. New Prime leads with 429 units, followed by Swift (372), Schneider (311), Crete Carrier (269), and Central Transport (177).
| Carrier | 2026 Units | Fleet Size | % 2026 |
|---|---|---|---|
| New Prime | 429 | 10,792 | 3.98% |
| Swift Transportation | 372 | 14,521 | 2.56% |
| Schneider National | 311 | 11,307 | 2.75% |
| Crete Carrier | 269 | 7,048 | 3.82% |
| Central Transport | 177 | 4,301 | 4.12% |
| J.B. Hunt | 155 | 20,760 | 0.75% |
| XPO Logistics | 106 | 6,551 | 1.62% |
| C.R. England | 108 | 4,229 | 2.55% |
| Stevens Transport | 85 | 2,543 | 3.34% |
| Heartland Express | 84 | 2,136 | 3.93% |
What's notable is the wide variance in renewal strategy. Crete Carrier and Central Transport are refreshing at nearly 4% while other large carriers remain below 1%. These decisions reflect different capital allocation philosophies, contract terms with manufacturers, and expectations about the freight market.
Unexpected Find: School districts are among the most aggressive 2026 buyers. LA Unified (81 units) and San Diego Unified (79 units) are investing heavily in new buses, reflecting both infrastructure funding and a push to modernize aging fleets.
What the OEMs Are Selling
The top 20 models account for 72% of all 2026 trucks sold. Beyond the expected leaders, several models show interesting momentum:
| Model | Units | Market Share |
|---|---|---|
| Freightliner Cascadia 126 | 7,664 | 16.5% |
| Freightliner Sprinter 3500 | 4,326 | 9.3% |
| Kenworth T880 | 3,782 | 8.1% |
| Peterbilt 379 | 2,488 | 5.3% |
| Freightliner FLD120 | 2,032 | 4.4% |
| Peterbilt 589 | 1,451 | 3.1% |
| Volvo VNR64T300 | 1,231 | 2.6% |
| Kenworth W900L | 1,117 | 2.4% |
| Kenworth T680 | 926 | 2.0% |
| International 9200 | 929 | 2.0% |
The strong showing of classic models like the Peterbilt 379 and Kenworth W900L—trucks favored by owner-operators—reinforces the small fleet purchasing trend we identified earlier. These drivers want traditional styling and proven reliability over the latest aero-optimized designs.
Fleet Age Distribution
Looking at the overall age distribution of the American truck fleet, we see a market that's been steadily renewing:
| Model Year | Truck Count | % of Total |
|---|---|---|
| 2026 | 46,585 | 1.63% |
| 2025 | 134,586 | 4.72% |
| 2024 | 242,204 | 8.49% |
| 2023 | 265,793 | 9.31% |
| 2022 | 293,059 | 10.27% |
| 2021 | 223,540 | 7.83% |
| 2020 | 341,459 | 11.97% |
| 2019 | 333,769 | 11.70% |
| 2018 | 242,486 | 8.50% |
| 2017 | 218,492 | 7.66% |
| 2016 | 290,492 | 10.18% |
| 2015 | 221,105 | 7.75% |
The 2019-2020 cohort remains the largest at 23.67%, suggesting those trucks—now 6-7 years old—are approaching the typical replacement cycle. Fleets running those units will be key targets for OEM sales teams over the next 12-24 months.
As 2026 unfolds, we expect the market share of this model year to reach 4-5% by December—tracking with historical patterns from previous model year rollouts.
What This Means
For manufacturers and their sales teams: The data points to clear opportunities. Owner-operators and small fleets are buying at above-average rates, certain mid-sized carriers are renewing aggressively, and some enterprise carriers are outpacing their peers in fleet modernization.
For brokers and freight intermediaries: Understanding fleet age helps assess carrier reliability and operational capabilities. A carrier running a modern fleet signals investment in their business and often correlates with better service quality.
For the industry as a whole: The continued purchase of 2026 models—despite economic headwinds—suggests underlying confidence in freight demand and a commitment to maintaining safe, efficient operations.
AlphaLoop delivers real-time data on fleet composition, equipment age, and purchasing patterns directly to your CRM. Know which fleets are buying before your competitors do. Learn more →

